Apisense Pro AI System User Manual
System overview
Apisense Pro AI is an intelligent bee protection system that combines data from IoT devices with artificial intelligence algorithms. It enables remote monitoring of in-hive conditions, productivity analysis, early threat detection (including diseases) with high accuracy, and supports beekeepers' decisions. With the Apisense app, you manage your apiaries, review measurement data and respond to alerts and in-app messages in one place — on your smartphone or in a browser.
1. Purpose
- Monitoring in-hive conditions — temperature, humidity, pressure, weight and honey gain in real time. Continuous monitoring of environmental parameters allows you to react quickly to unfavorable changes.
- Productivity analysis — tracking honey gain, trends and charts for individual hives lets you assess harvest performance and the condition of the bee colony.
- Early threat detection — in-app alerts and notifications regarding the health of bee colonies (e.g. varroa, nosema, foulbrood) help you make appropriate decisions at an early stage of disease development.
2. Main features
- Dashboard — a summary of apiaries, hives, statuses and key measurements.
- Alerts and notifications — in-app notifications about parameter threshold violations and important events in the apiary.
- Reports and charts — visualization of measurement data in the form of daily, weekly and long-term charts with overlaid trends.
- Data history — archive of notes, inspections and notifications.
- Apiary management — adding and editing apiaries, hives, inspections, notes, as well as adding tests and registering samples.
Registration / Login
The Apisense Pro AI system is available at the following address: Apisense Pro AI and via the Apisense mobile app, which can be downloaded from Google Play and the App Store.
1. Registration
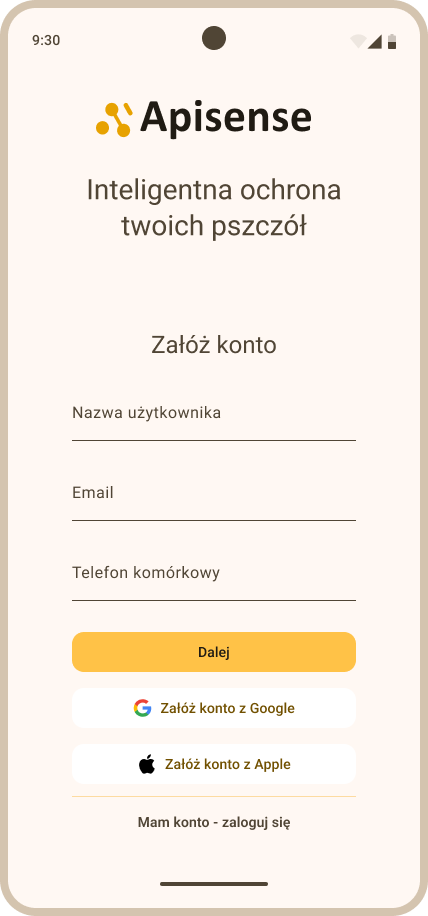
- Download the mobile app and launch it, or go to the following address: Apisense Pro AI. After launching the app, a screen will appear with the option to create an account (Fig. 1).
-
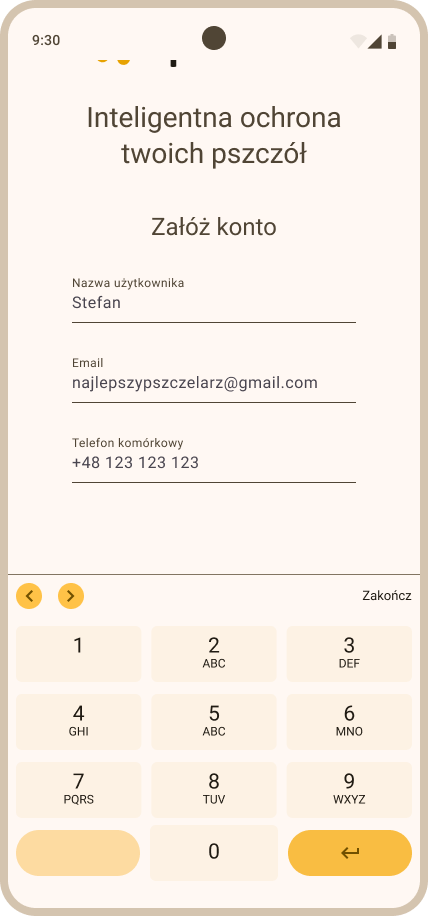
Enter the following details in the designated fields:
- User name
- Email address
- Mobile phone number
Confirm that you have read the terms and conditions and the privacy policy by checking the appropriate box, and then click Next (Fig. 2).
-
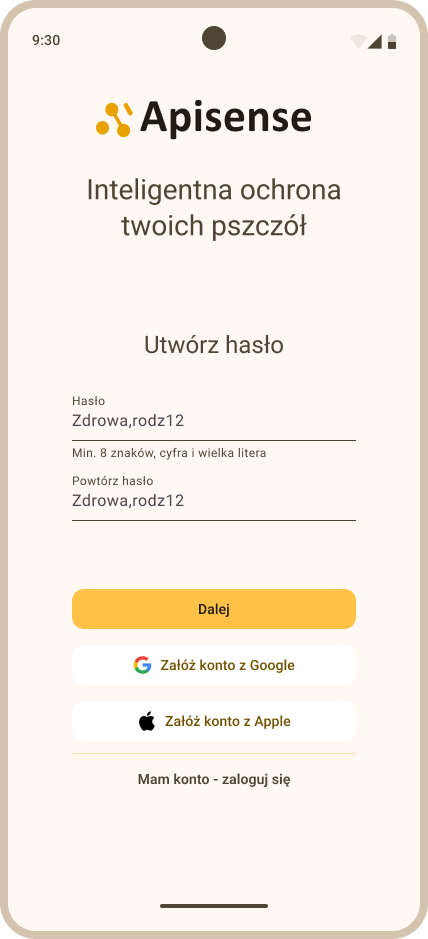
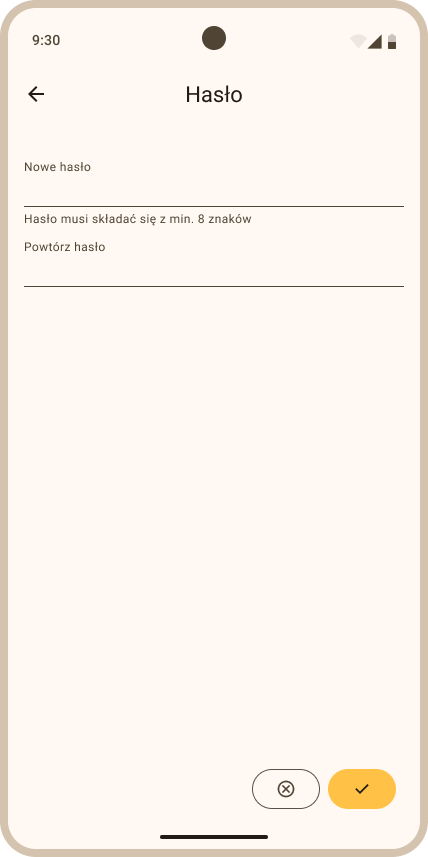
The next view will appear - Create password. In this view you will be asked to create a strong password (Fig. 3), which you will then use to log in to the system. The password must contain:
- At least 1 special character (e.g. #, $, %, _)
- At least 1 digit
- At least 1 uppercase letter
- At least 8 characters
Then enter the same password again in the Repeat password field and proceed to the next step by clicking Next.
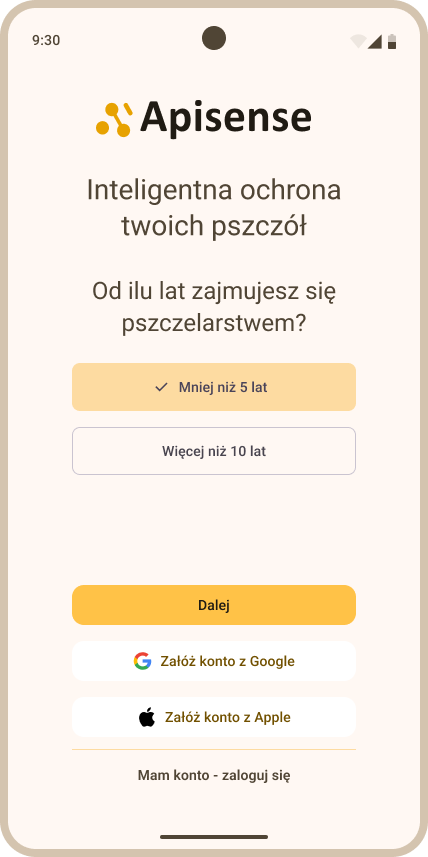
- This is the last stage of registration. In this step, answer the question about how many years you have been beekeeping by selecting one of the two available answers, then click Next (Fig. 4).
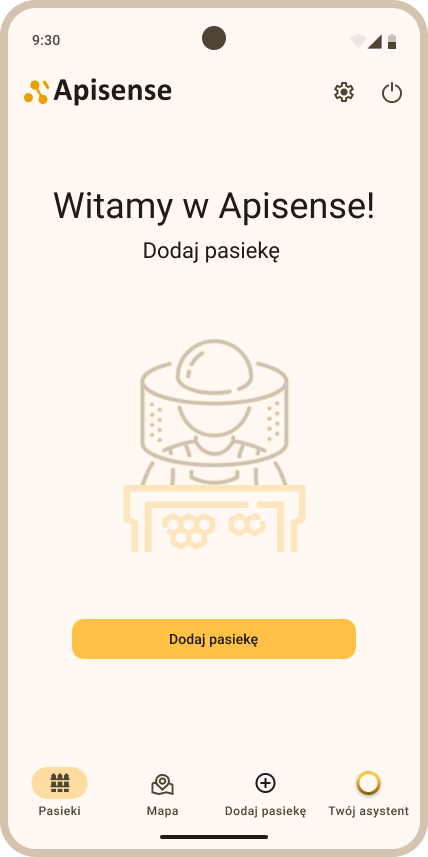
- If everything went smoothly you should see the following start screen - Welcome to Apisense! (Fig. 5):
2. Login
If you already have an account in the Apisense Pro AI System, follow these steps:
-
Launch the Apisense mobile app or go to the following address: Apisense Pro AI.
-
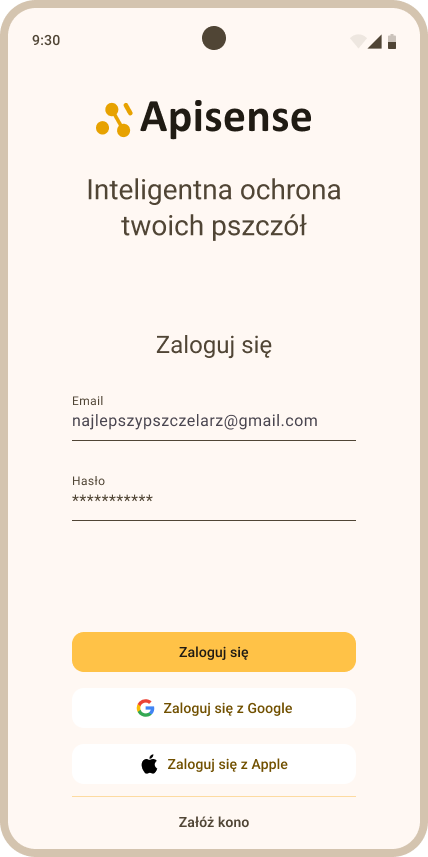
In the Sign in view (Fig. 6), enter the appropriate data into the designated fields, the same data you provided during registration:
- user name
- password
Then click Sign in; you should see the Apisense app start view - the Apiaries tab.
Apiary management
1. Apiary
1.1 Adding an apiary
- In the Apiaries tab (the start view after logging in to the Apisense app) click the Add apiary tab in the menu at the bottom of the screen or — if you do not yet have any apiary — the yellow Add apiary button visible in the center of the screen (Fig. 7).

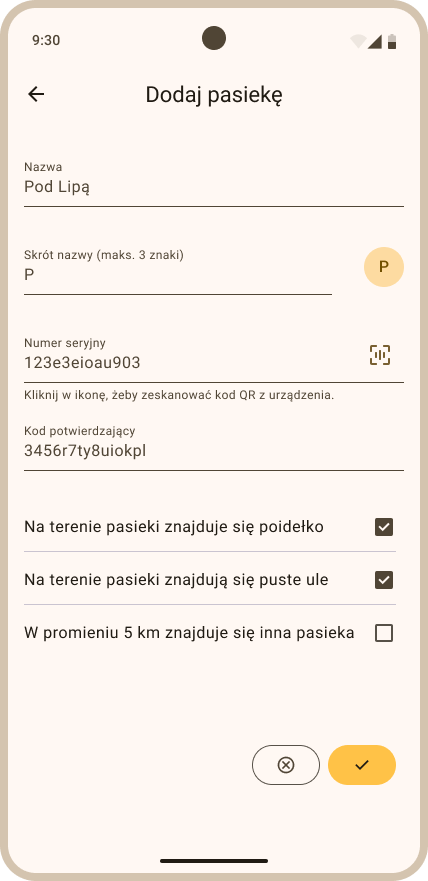
- As a result, the Add apiary view will be displayed (Fig. 8).
1.1.1 Adding an apiary with devices
In the Add apiary view (Fig. 8), fill in the following fields:
- Name — the apiary name that will be displayed in the panel,
- With devices — check this option to add an apiary and link it with an Apisense Hub device.
The Name field can be edited by the user at any time.
After filling in the information above, click the yellow button with the arrow in the lower right corner of the screen. You will be taken to the next step of adding the apiary, where you link the Apisense Hub to your apiary. Fill in the following fields:
- Hub — click the QR code icon on the right side of this field and scan the QR code from the sticker on the Apisense Hub device. The next field, Confirmation code, will be filled in automatically.
- Confirmation code — filled in automatically after the QR code is scanned correctly.
After filling in the required data and scanning the QR code, click the yellow button at the bottom of the screen to confirm creation of the apiary with the linked Apisense Hub device.
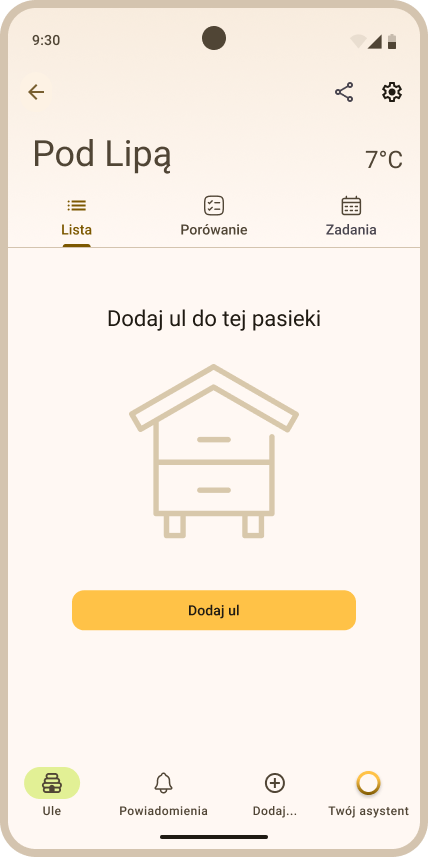
If the apiary was created successfully, you will be redirected to its interior (the Hives view), and when you go to the Apiaries tab the apiary you just created will appear on your apiary list (Fig. 9). The apiary tile will show the relevant statuses or tips on how to start the Apisense Hub (see First device startup). To learn more about statuses, go to chapter 7. Interpretation of statuses and icons used in the system.
1.1.2 Adding an apiary without devices
To add an apiary without devices, in the Add apiary view:
- in the Name field, enter the name under which the apiary will be displayed in the app,
- check the Without devices option.
After filling in the information above, click the yellow button at the bottom of the screen to confirm creation of the apiary without devices.
If the apiary was created successfully, you will be redirected to its interior (the Hives view), and when you go to the Apiaries tab the apiary you just created will appear on your apiary list (Fig. 10). The apiary tile will not show Hub battery and LTE icons or weather data — only the apiary name will be displayed.
Note
Apiary without devices: You can create an apiary by providing only the name and selecting Without devices, but an apiary created without a Hub cannot have a Hub assigned later, even when editing apiary settings. Furthermore, if an apiary was created without a Hub, you cannot assign Scale or VitalSensor devices to any hive in that apiary — the Equipment section will not be available when adding hives. You can still add hives without devices and keep records (notes, inspections, tasks).
1.2 Editing an apiary
- In the Apiaries tab (the start view after logging in to the Apisense app), click the tile of the chosen apiary. As a result, the Hives tab will open (Fig. 11).
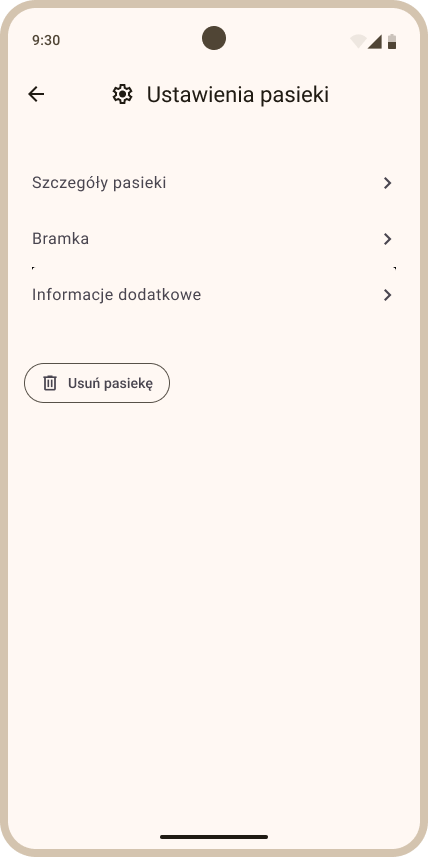
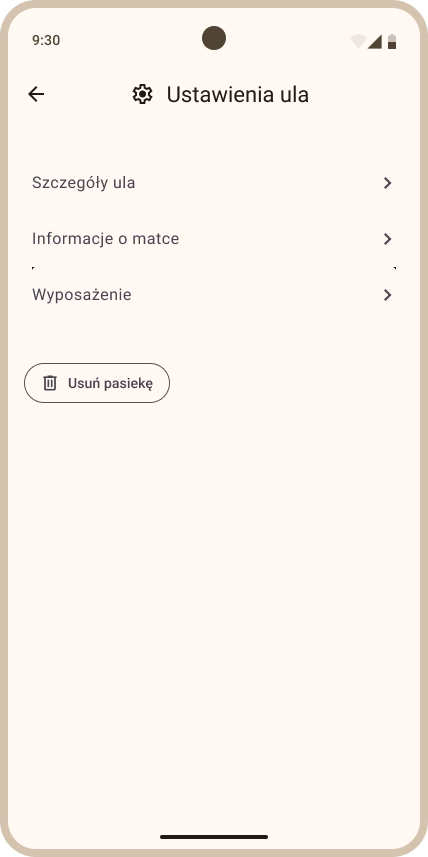
- In the Hives tab click the cog icon in the upper right corner of the screen. After clicking the cog, the Apiary settings view will open (Fig. 13).
-
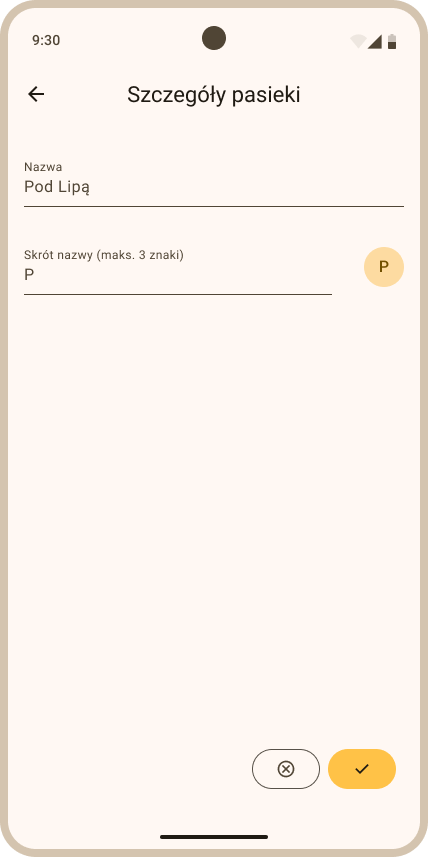
The Apiary settings view is divided into 2 sections. To update the information in a given section, click its header. Available sections:
- Apiary details - this section allows you to edit parameters such as the apiary name and its abbreviation. To do so, click the chosen field and enter the changes.
- Hub - this section concerns parameters related to the Apisense Hub device. The information in this section cannot be edited.
-
To save your changes, click the yellow button in the lower right corner of the screen (Fig. 14).
1.3 Deleting an apiary
- In the Apiaries tab (the start view after logging in to the Apisense app), click the tile of the chosen apiary. As a result, the Hives tab will open (Fig. 15).
- In the Hives tab click the cog icon in the upper right corner of the screen. After clicking the cog, the Apiary settings view will open (Fig. 17).
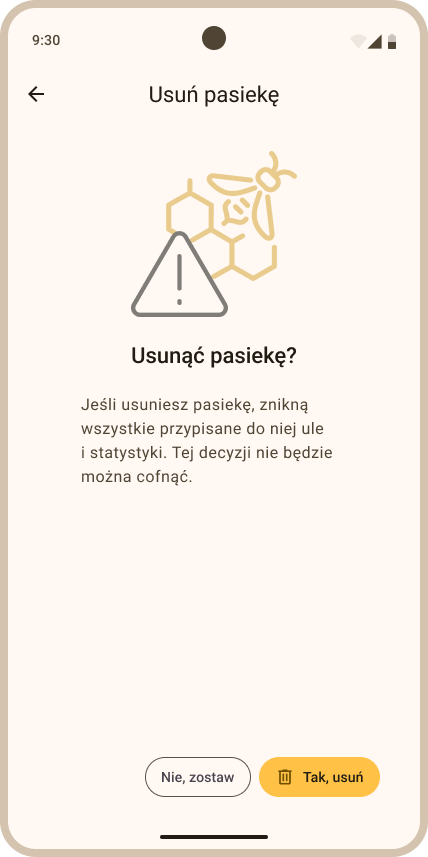
- In the Apiary settings view click the Delete apiary button. As a result, the Delete apiary view will be displayed (Fig. 18), where you must confirm your choice with the Yes, delete button.
- Together with the deleted apiary, all of its contents (hives, notes, inspections, etc.) are also deleted. Individual devices (Hub, Scale, VitalSensor) are also unlinked and their measurement history is cleared. Therefore, for example, you will be able to use the same Apisense Hub when creating a new apiary.
2. Hive
2.1 Adding a hive
- While in the Apiaries tab (the start view after logging in to the Apisense app (Fig. 19)) click the tile of the apiary to which you want to add a hive. After clicking the tile, the single apiary view will be displayed (Fig. 20).
- To add a hive to this apiary click the Add... tab on the bottom menu bar and select the Add hive option (Fig. 21); the Add hive view will be displayed (Fig. 21).
-
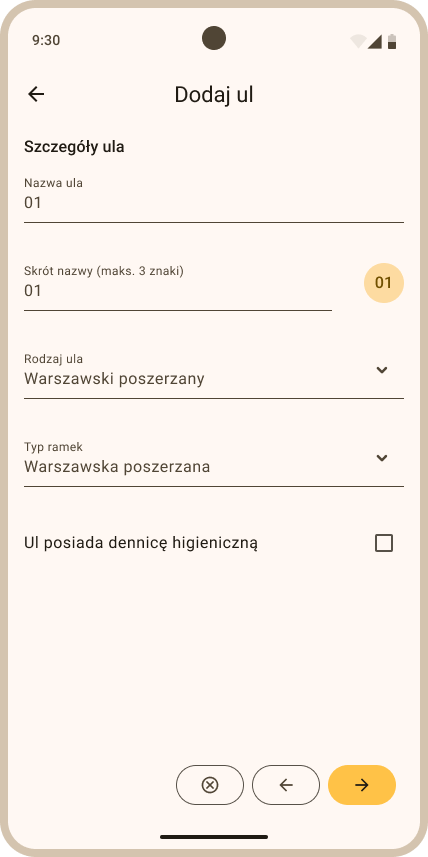
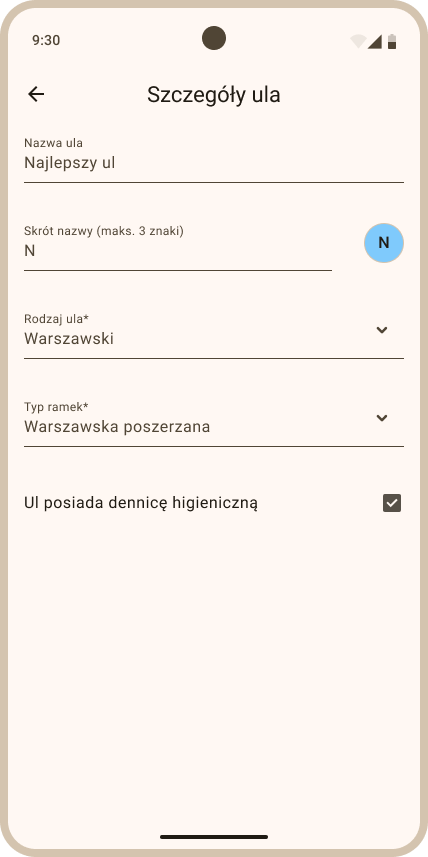
Fill in the individual fields in the Add hive view - the Hive details section (Fig. 22):
- Hive name - enter a name for your hive - the hive will be displayed in the panel under this name.
- Maximum number of frames in the brood box - enter the maximum number of frames that can fit in the hive's brood box.
- Checkbox - check if the hive has a hygienic bottom board.
The information above can be edited by the user at any time.
-
To proceed to the next stage of adding a hive, click the yellow button with the right-pointing arrow at the bottom of the screen.
-
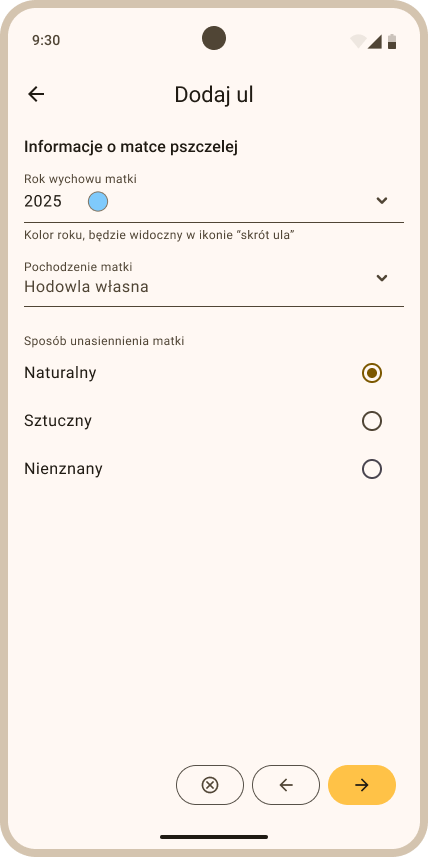
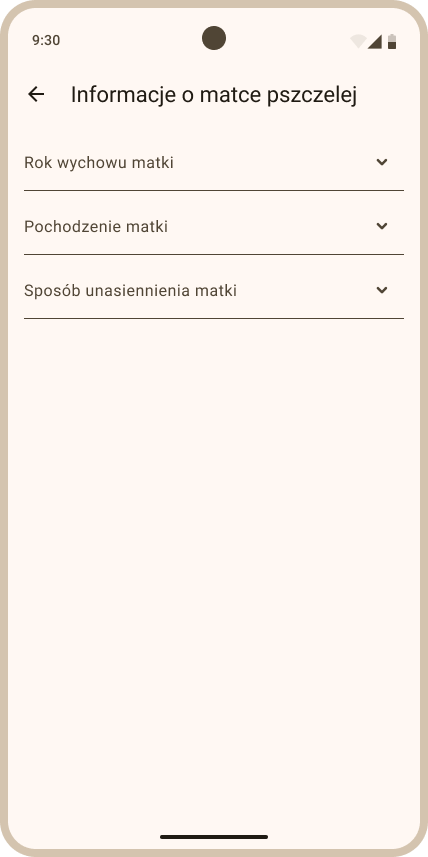
Queen bee information: At this stage of adding a hive, fill in the queen bee information (Fig. 23):
- Year the queen was raised - select the year the queen bee was raised from the drop-down list (click the down arrow visible to the right of this field).
- Queen origin - select one of the options available in the drop-down list (click the down arrow visible to the right of this field).
- Queen insemination method - select one of the available options.
The information above can be edited by the user at any time.
- Then click the yellow button with the right-pointing arrow at the bottom of the screen to proceed to the Equipment section.
Note
The Equipment section is available only when the apiary has an Apisense Hub assigned. If the apiary has no Hub, clicking the yellow button in the lower right corner of the screen will save and add an empty hive (without measurement devices) with the information entered above.
2.1.1 Adding a hive with devices
-
Equipment: The last stage involves linking devices to this specific hive. Note: It is essential that the devices configured for the hive (Scale and VitalSensor) are actually installed in the same physical hive.
Note
Hub requirement: To link Scale or VitalSensor to a hive, the apiary must have an Apisense Hub assigned. Otherwise the Equipment section will not be available when adding or editing a hive.
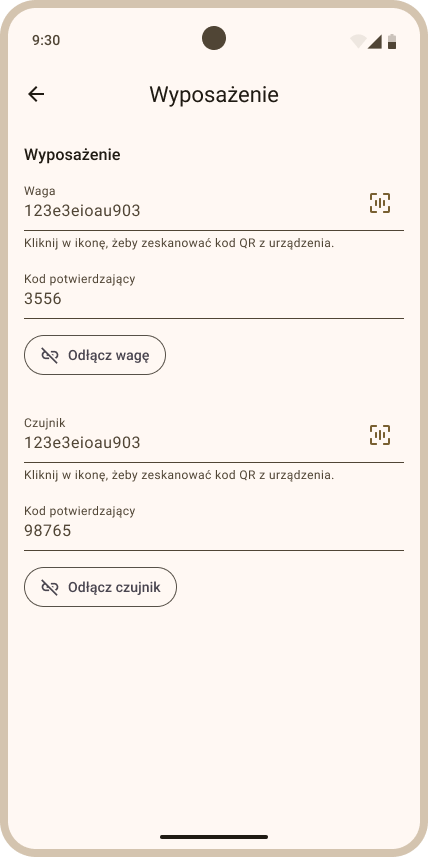
To link an Apisense Scale to the hive, fill in the following fields (Fig. 24):
- Scale — click the QR code icon on the right side of this field and scan the QR code from the sticker on the Apisense Scale. The next Confirmation code field will be filled in automatically.
- Confirmation code — filled in automatically after a successful QR scan.
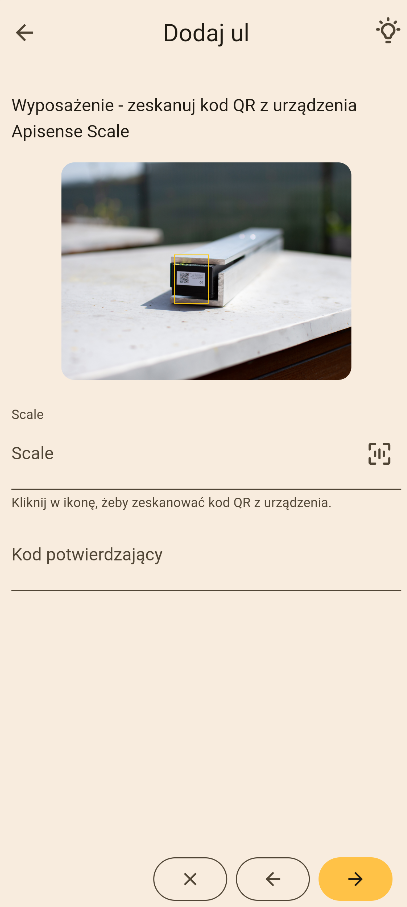
Fig. 24: Adding a hive — Equipment section, linking Scale Then click the yellow button in the lower left corner of the screen to proceed to linking the Apisense VitalSensor (Fig. 25):
- VitalSensor — click the QR code icon on the right side of this field and scan the QR code from the sticker on the Apisense VitalSensor or from an Apisense Tag. The next Confirmation code field will be filled in automatically.
- Confirmation code — filled in automatically after a successful QR scan.
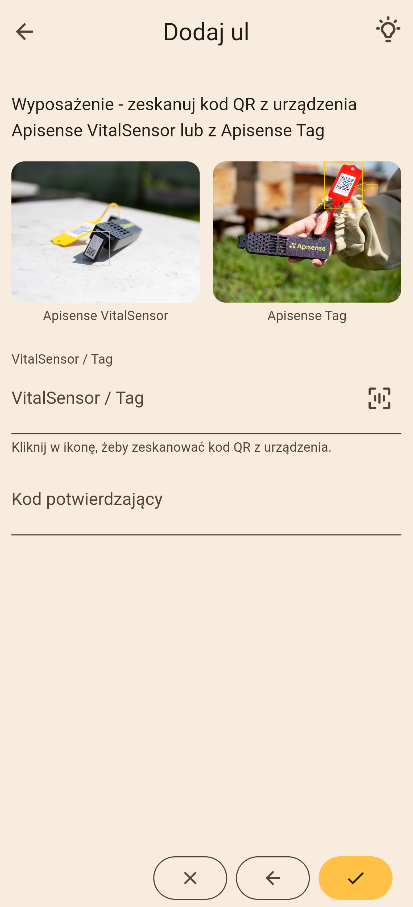
Fig. 25: Adding a hive — Equipment section, linking VitalSensor
Note
You can also assign only one device to a hive. To create a hive with VitalSensor only, leave the Scale and confirmation code fields empty, proceed to VitalSensor and scan the QR code, then save. To create a hive with Scale only, leave the VitalSensor and confirmation code fields empty and click the yellow save button.
-
After filling in the chosen sections and required fields, click the yellow button in the lower right corner of the screen to add the hive with the linked devices (Scale and/or VitalSensor).
-
If the hive was created successfully, you will be redirected to the Hives view, and the hive you just created will appear in your hive list (Fig. 26, Fig. 27).
2.1.2 Adding a hive without devices (without Scale and VitalSensor)
If you want to create a hive for record-keeping only (without monitoring):
- Go through the Hive details and Queen bee information steps as when adding a hive normally.
- In the Equipment section, do not fill in the Scale, VitalSensor or confirmation code fields — leave them empty (do not scan QR codes).
- Click the yellow button in the lower right corner of the screen to save the hive without devices.
After creating a hive without devices:
- The hive tile will not show live measurements (temperature, weight) or VitalSensor-based colony health assessment (Fig. 28).
- Features that require VitalSensor (e.g. Register sample) will not be available until you assign a device.
- You can add Scale and VitalSensor later in Hive settings → Equipment, provided the apiary has a linked Hub.

2.2 Editing a hive
- In the Apiaries tab (the start view after logging in to the Apisense app), click the tile of the chosen apiary. As a result, the Hives tab will open (Fig. 29).
- In the Hives tab click the tile of the chosen hive; this will open the Details tab (Fig. 31).
- Then click the cog icon in the upper right corner of the Details tab; the Hive settings view will be displayed (Fig. 32).
-
The Hive settings view is divided into 3 sections. To update the information in a given section, click its header. Available sections:
-
Hive details - this section allows you to edit parameters such as the hive name, the maximum number of frames in the brood box, and the hygienic bottom board. To do so, click the chosen field and enter the changes, or check/uncheck the box next to a given item.
-
Queen information - this section concerns data related to the queen bee (year raised, origin, insemination method). To update the data in this section, select the appropriate item from the relevant drop-down list (e.g. Queen origin -> item: Own breeding).
-
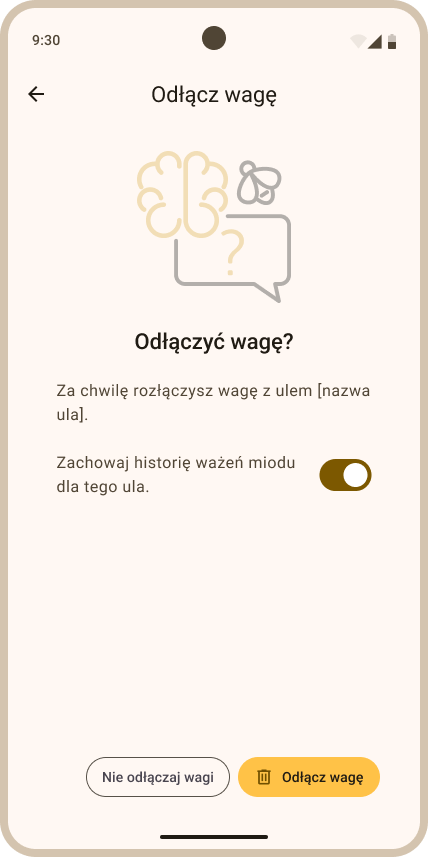
Equipment - this section contains information about devices linked to the hive (VitalSensor, Scale). The section allows you to remove the device assignment from this hive. To do so, click the Disconnect VitalSensor / Disconnect Scale button depending on which device is to be unlinked, and then confirm your choice using the yellow Disconnect button (Fig. 33). When unlinking devices, their measurement history is preserved by default, which means past measurement data will be available on charts until this hive is deleted. To clear the measurement history in the hive from the device being unlinked, use the toggle. If the hive equipment does not include one of the devices (the fields are empty), you can also link a Scale/VitalSensor to the hive from this place. To do so, click the QR code icon on the right side of the VitalSensor/Scale field and scan the QR code from the appropriate measurement devices.
Note
The Equipment section is not available if the apiary does not have an Apisense Hub assigned.
-
- To save the changes you made in the chosen section, click the yellow button in the lower right corner of the screen.
2.3 Deleting a hive
- In the Apiaries tab (the start view after logging in to the Apisense app), click the tile of the chosen apiary. As a result, the Hives tab will open (Fig. 35).
- In the Hives tab click the tile of the chosen hive; this will open the Details tab (Fig. 37).
- Then click the cog icon in the upper right corner of the Details tab; the Hive settings view will be displayed (Fig. 38).
- In the Hive settings view click the Delete hive button. As a result, the Delete hive view will be displayed (Fig. 39), where you must confirm your choice with the Yes, delete button.
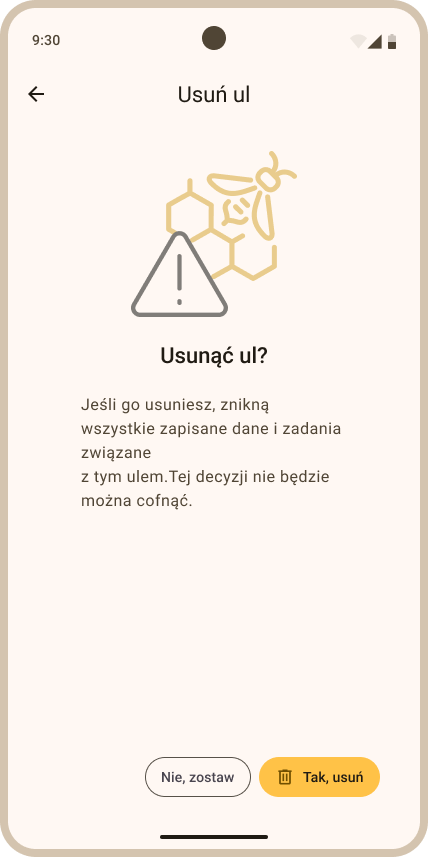
- Together with the deleted hive, all of its contents (notes, inspections, etc.) are also deleted. Individual devices (Scale, VitalSensor) are also unlinked and their measurement history is cleared. Therefore, for example, the same Apisense VitalSensor can be linked to another hive (one that does not have this type of device).
3. Adding inspections
- While in the Apiaries tab (the start view after logging in to the Apisense app) click the apiary tile. After clicking the tile, the Hives view will be displayed (Fig. 40).
- Then click the tile of the hive for which you want to perform an inspection. As a result, the Hive details view will be displayed (Fig. 42).
- To add an inspection, choose the Add... option from the bottom menu, then Inspection (Fig. 43); the Add inspection view will be displayed (Fig. 43).
-
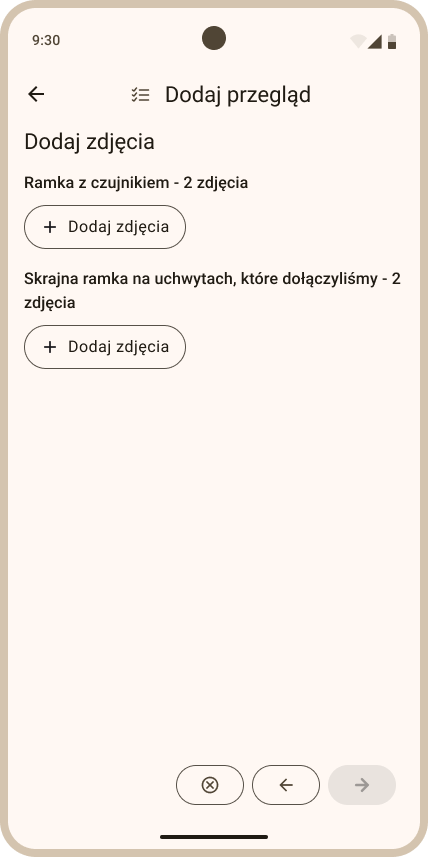
In the Add inspection view (Fig. 44), attach 2 photos each for:
-
the frame with the VitalSensor,
- the outer frame on the holders we provided.
To add photos, click the Add photo button and then choose the Take photo or Add photo from gallery option.
-
Once you have added the photos correctly, click the yellow arrow in the lower right corner to proceed to the next step.
-
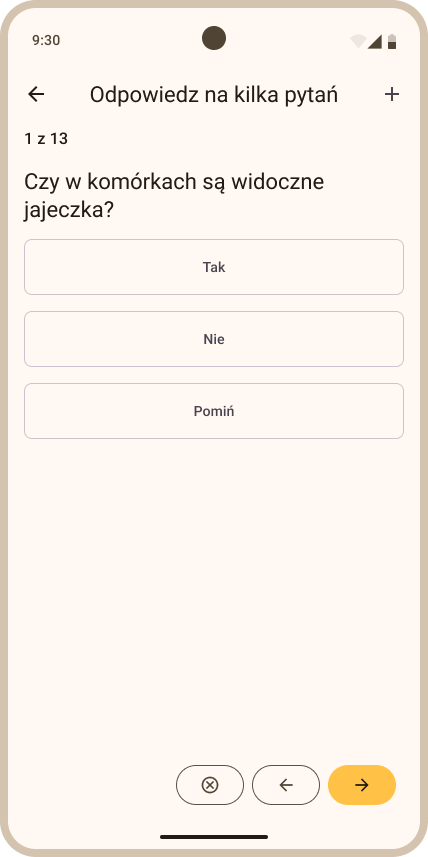
Then answer a few questions (Fig. 46). Choose Yes, No or Skip.

- To proceed to the next inspection question, click the yellow button with the right-pointing arrow at the bottom of the screen.
- After answering all of the inspection questions, the final view will be displayed (Fig. 47), where you must select the inspection date (the current date is set by default).
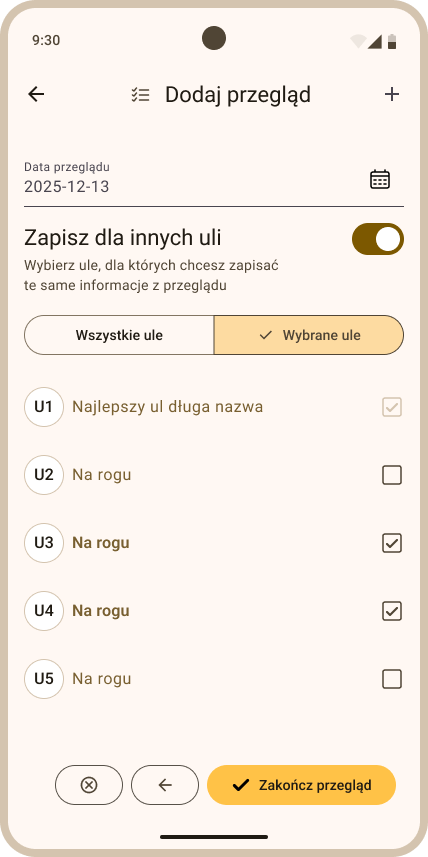
- To save the inspection, click the yellow Finish inspection button in the lower right corner of the screen. The saved inspection will be displayed in the inspection list under Hive details > Inspection (Fig. 48).
4. Notes
4.1 Adding a note
The steps below refer to adding a note from the hive level.
- In the Apiaries tab (the start view after logging in to the Apisense app) click the apiary tile. After clicking the tile, the Hives view will be displayed (Fig. 49).
- Then click the tile of the hive to which you want to add a note. As a result, the Hive details view will be displayed (Fig. 51).
- To add a note, choose the Add... option from the bottom menu, then Note (Fig. 52); the Add note view will be displayed (Fig. 53).
-
In the Add note view (Fig. 53), fill in the following fields:
- Date - choose the date you want the note saved with (current by default).
- Title - enter the note title (optional field).
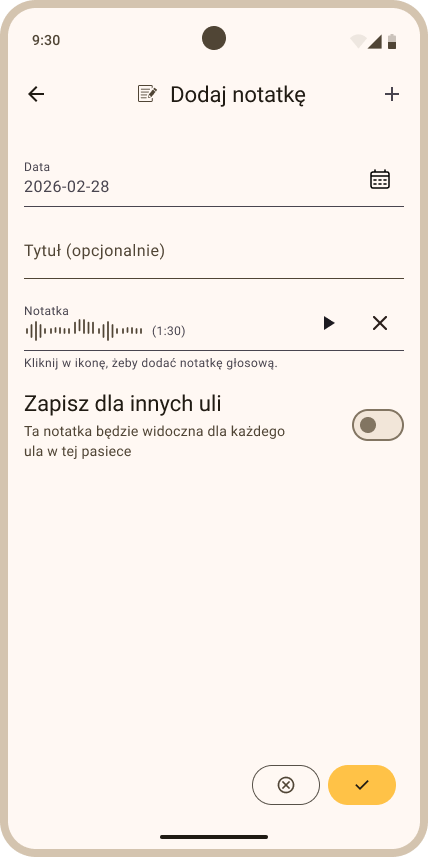
- Note - enter the note content (text), or click the microphone icon on the right side of this field to record a voice note.
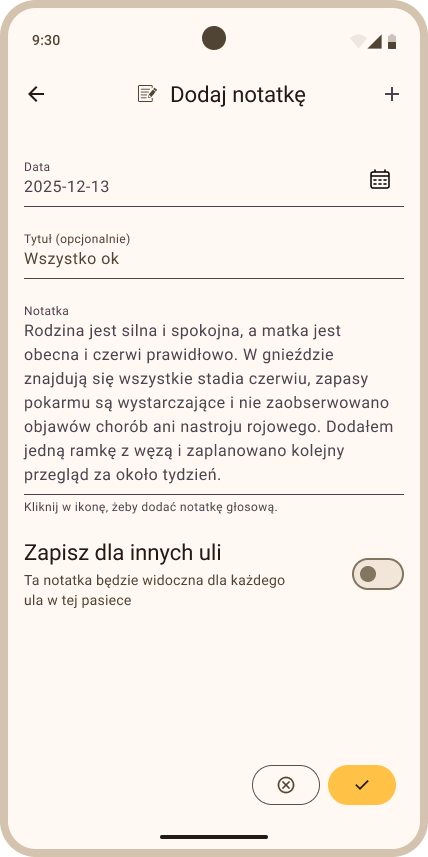
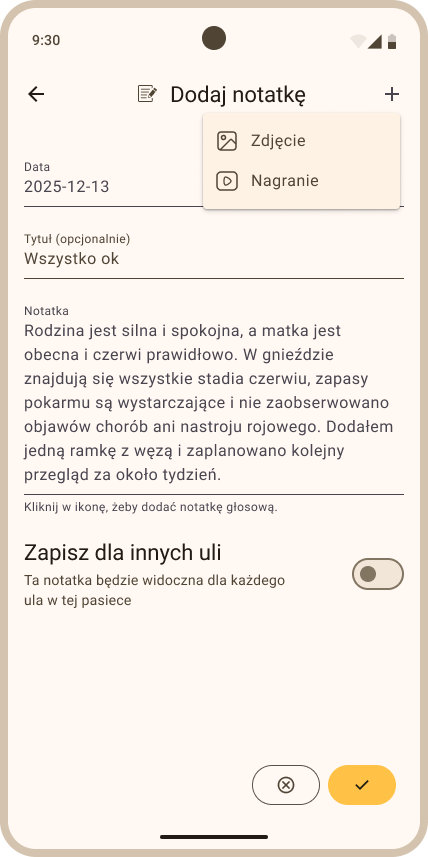
- You can also add a photo or recording to the note. To do so, click the + button in the upper right corner of the Add note view (Fig. 55).
- To save the note, click the yellow button in the lower right corner of the screen. The saved note will be displayed in the note list under Hive details > Notes (Fig. 56).
Note — adding a note from the apiary level: A note can also be created from the apiary level. To do so, follow this path: in the Apiaries tab click the chosen apiary, then in the Hives tab choose the Add... option from the bottom menu and the Note option. As a result, the same note will be saved automatically to all hives in the chosen apiary and will be visible in the note list of every hive (Details > Notes). Editing such a note applies only to the copy in a specific hive — changes made to one note will not be visible in the other notes added in this way. Likewise, deleting such a note in one of the hives will leave notes in the other hives untouched.
4.2 Editing a note
- In the Apiaries tab (the start view after logging in to the Apisense app) click the apiary tile. After clicking the tile, the Hives view will be displayed (Fig. 57).
- Then click the tile of the hive in which you want to edit a note. As a result, the Hive details view will be displayed (Fig. 59).
- Go to the Notes tab (top menu); the view with the list of notes assigned to the chosen hive will open (Fig. 60).
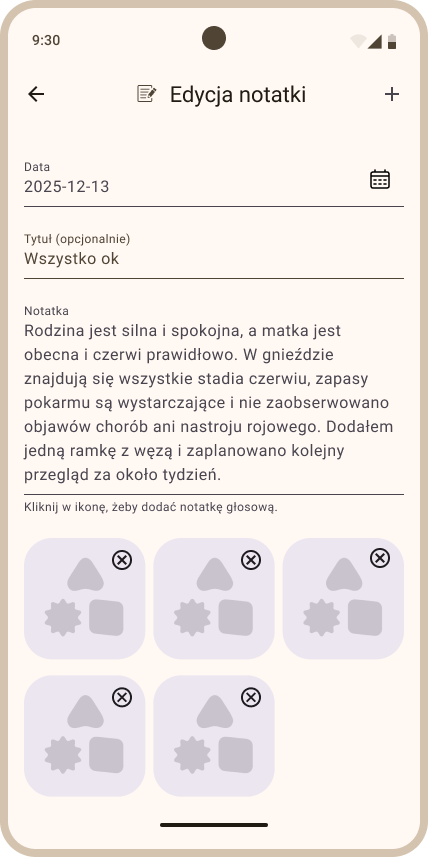
- To update a note, click the pencil icon next to the note that needs editing. After clicking the pencil icon, the Edit note view will be displayed (Fig. 61).
-
In the Edit note view you can update the values for the following fields:
- Date - click the calendar icon and choose the appropriate date.
- Title - enter the new title in the designated place.
- Note - change the note content - modify the text or delete it and record a voice note.
- Add or remove a photo/recording using +/X.
-
After making changes, click the yellow button in the lower right corner to save the modified note.
4.3 Deleting a note
- In the Apiaries tab (the start view after logging in to the Apisense app) click the apiary tile. After clicking the tile, the Hives view will be displayed (Fig. 62).
- Then click the tile of the hive from which you want to delete a note. As a result, the Hive details view will be displayed (Fig. 64).
- Go to the Notes tab (top menu); the view with the list of notes assigned to the chosen hive will open (Fig. 65).
- To delete a note, grab and swipe the row with the chosen note to the left. As a result, a red button with a bin icon will be displayed on the right side of that row. Click the bin icon (Fig. 66) and choose the Delete option in the message that appears to confirm note deletion.
5. Tasks
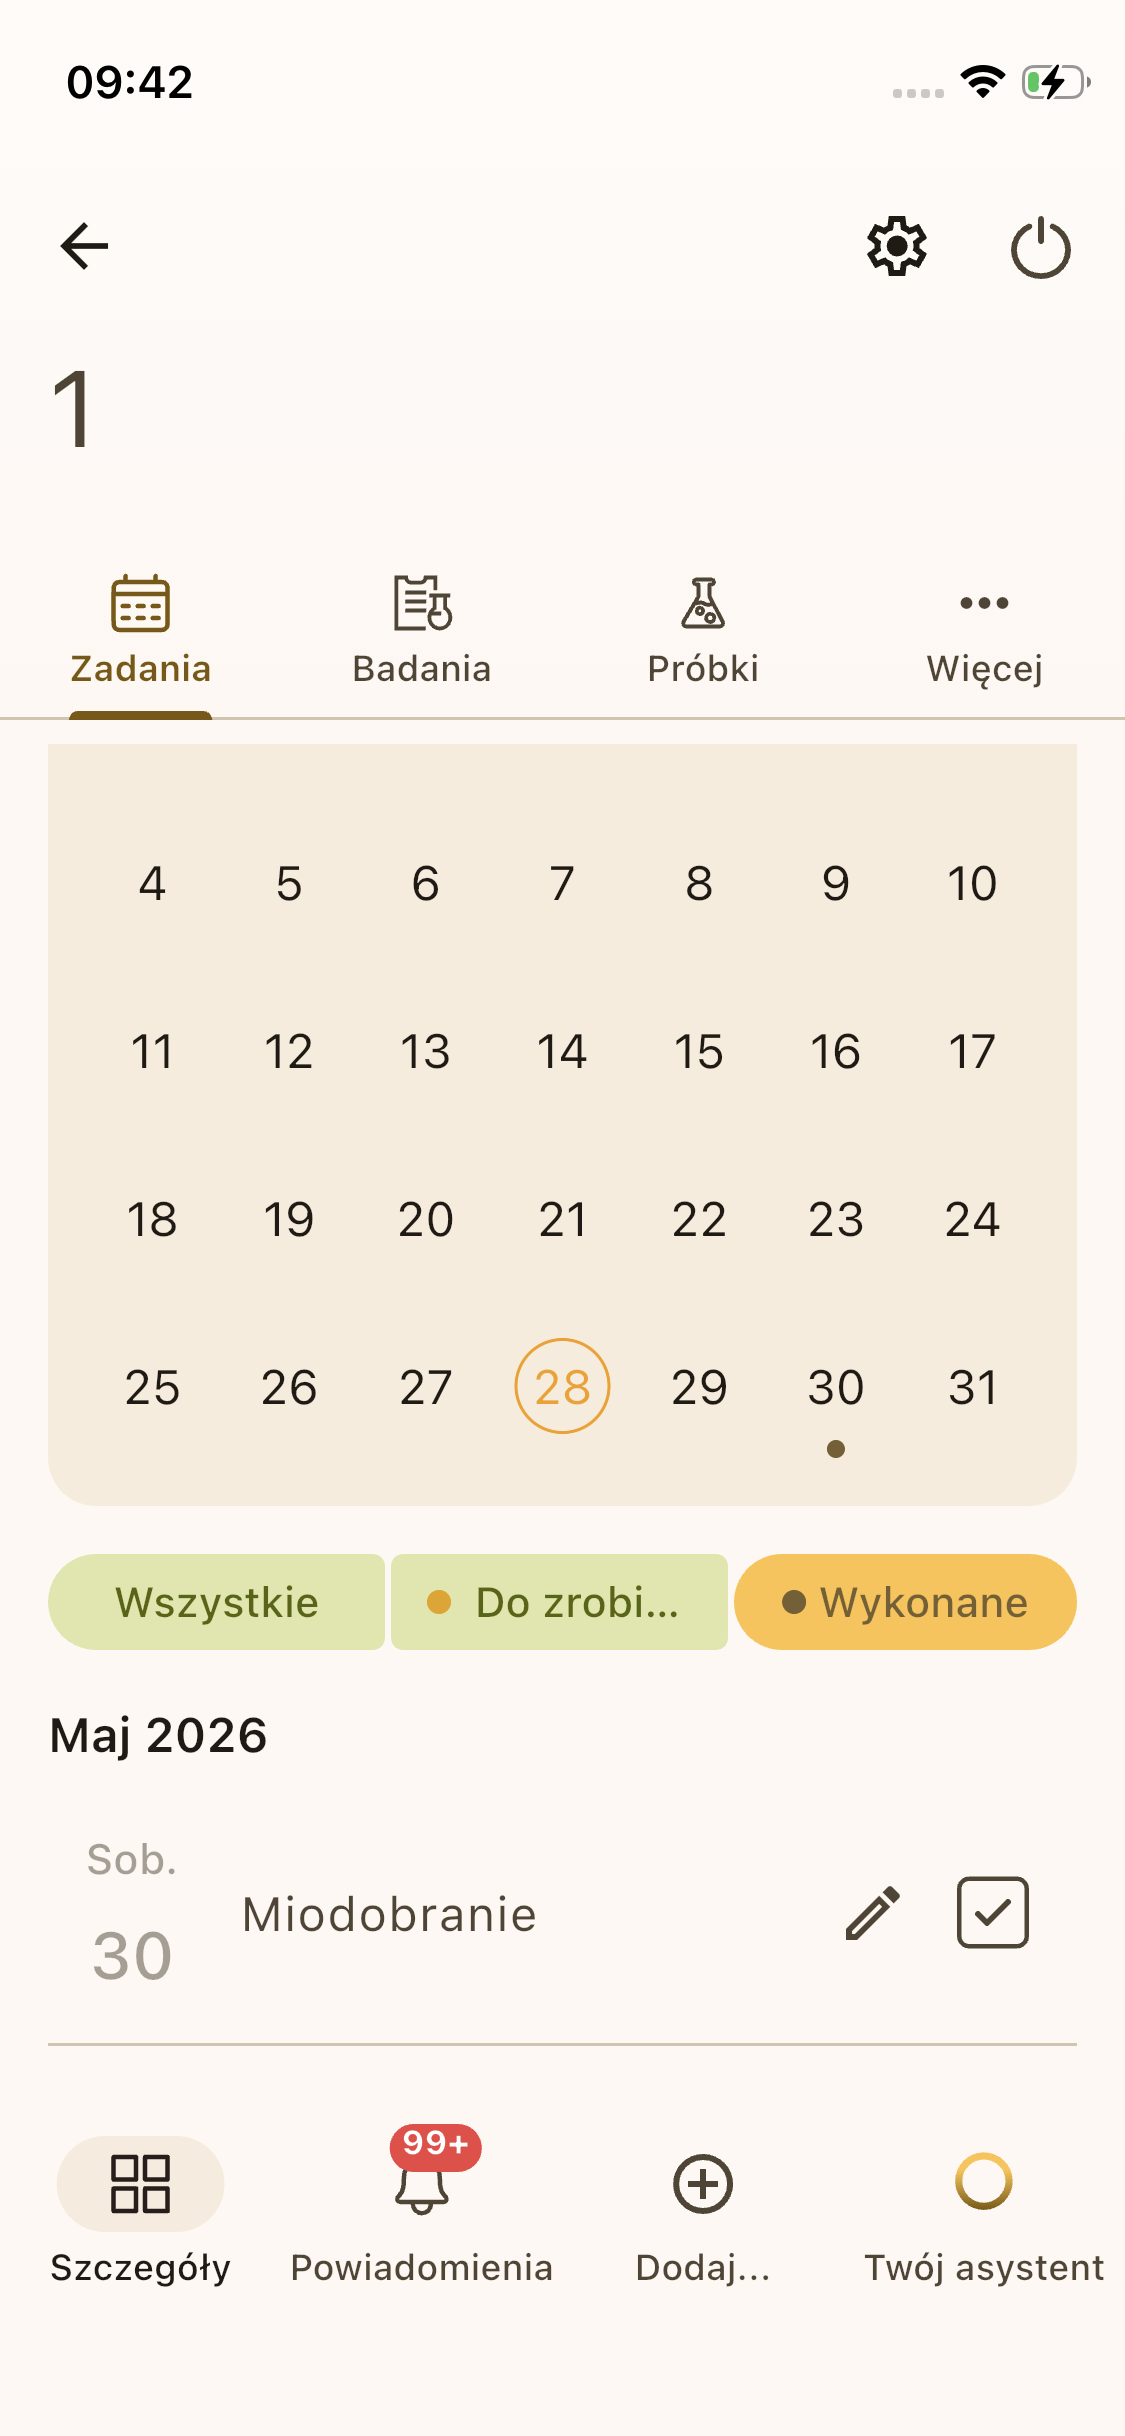
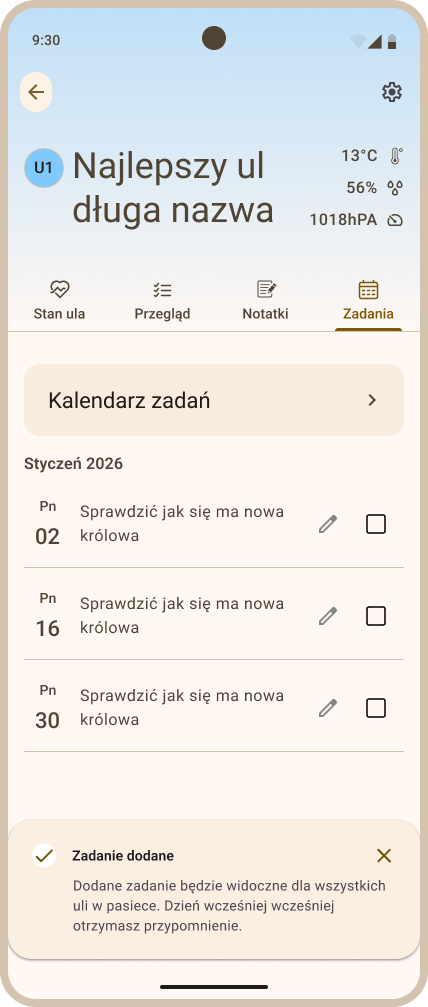
Tasks (calendar) let you plan apiary work — inspections, feeding, honey harvests, maintenance. Each task has a date, a status (To do / Done) and a scope that defines which apiaries and hives it applies to. Tasks can repeat (series) and be marked as done as you carry them out.
5.1 What is a task
Each task contains the following information:
- Task — short description/name of the task, contextual note (required field).
- Task date — when the task is to be done.
- Status — To do (planned) or Done. Note: Task status can only be changed after the task has been added to the calendar.
- Scope — whether the task applies to the whole apiary, selected hives, or a single hive (see 5.2 Task scope).
- Recurrence — optional; every 1 week, 2 weeks, 1 month or 3 months, with a series end date (see 5.5 Repeating tasks).
5.2 Task scope (where it is visible and editable)
The scope defines where the task is visible and from where it can be edited and deleted.
| Scope | Visible in apiary view | Visible in hive views | Editable from hive level |
|---|---|---|---|
| Whole apiary | Yes | Yes — in all hives | No |
| Selected hives | Yes | Yes — only in selected hives | No |
| Single hive | Yes | Yes — only in that one hive | Yes |
Tip
Tasks with scope Whole apiary or Selected hives can be edited and deleted only from the apiary level — from the hive level they are read-only. A task created for a single hive can be edited and deleted from that hive's level, as well as from the apiary level.
5.3 Adding a task from the apiary level
From the apiary level you can create a task for the whole apiary (Scope: Apiary), for selected hives, or several tasks in a series.
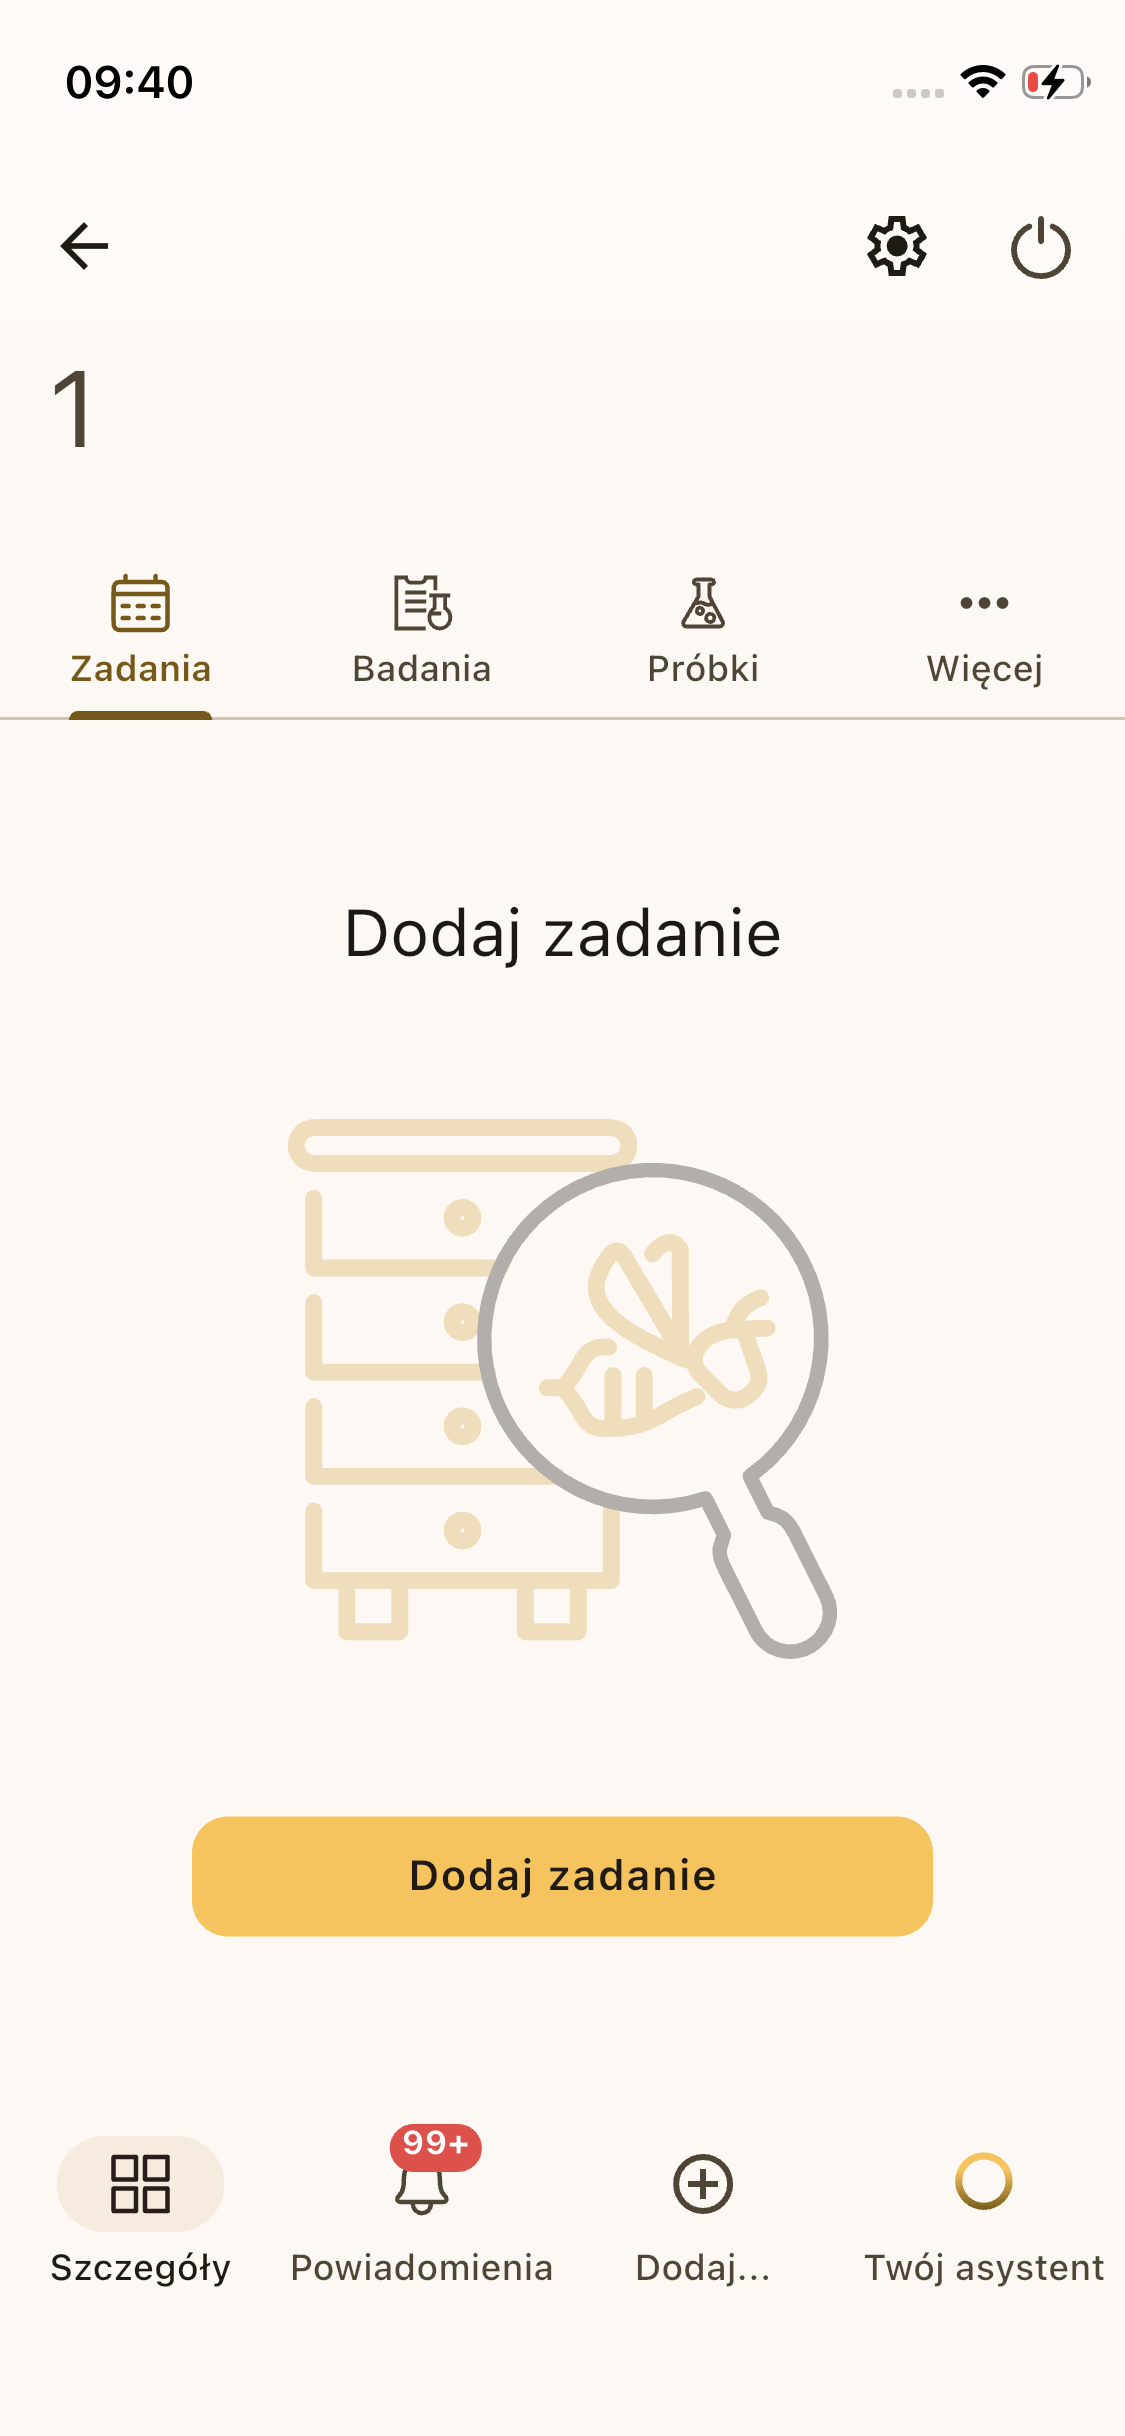
- In the Apiaries tab, click the tile of the apiary for which you want to add a task. The Hives view will be displayed.
- From the bottom menu choose Add..., then Task (Fig. 67). The Add task view will be displayed.
-
In the Add task view fill in the following fields:
- Scope — select one of:
- Apiary — the task will appear in all hives in this apiary.
- Selected hives — after choosing this option, select the specific hives from the list.
- Task — enter the task content (e.g. Spring inspection).
- Task date — choose the task date (current date by default).
- Recurrence (optional) — see 5.5 Repeating tasks.
- Scope — select one of:
-
To save the task, click the yellow button in the bottom right corner of the screen. The saved task will appear on the apiary task list (Tasks tab) and in all hives in this apiary (Hive details > More > Tasks).
5.4 Adding a task from the hive level
A task added from the hive level will appear on the task list in that specific hive and in the apiary. Such a task can also be edited or deleted from both levels — apiary and hive.
To add a task from the hive level:
- In the Apiaries tab click the apiary tile, then click the hive tile for which you want to add a task. The Hive details view will be displayed.
- From the bottom menu choose Add..., then Task (Fig. 68). The Add task view will be displayed.
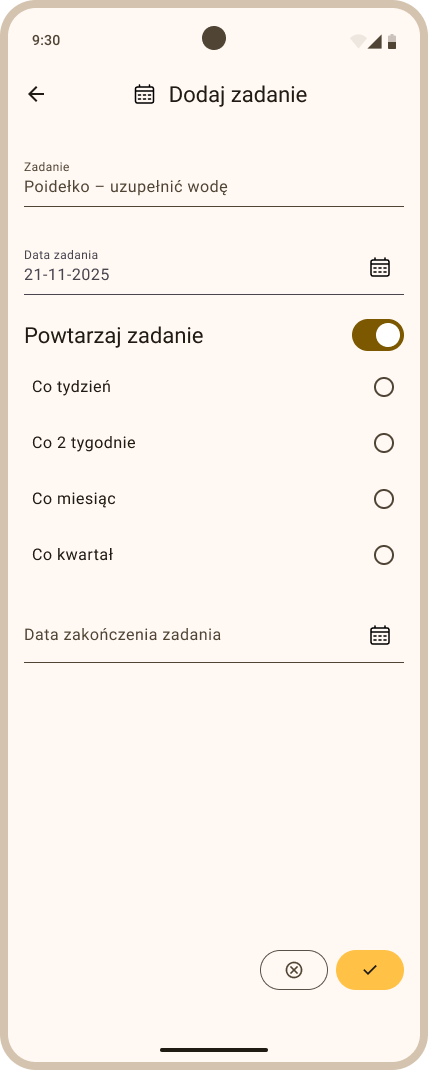
- Fill in Task (required), Task date, and optionally check Repeat task. There is no scope picker — the task automatically applies to this hive.
- Click the yellow save button in the bottom right corner.
5.5 Repeating tasks
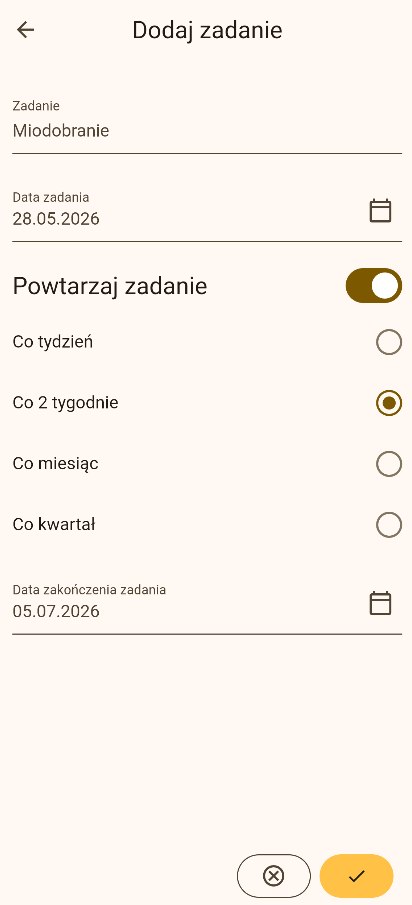
A task can be configured to repeat (Fig. 69). In the Repeat task section of the Add task view choose:
- Frequency — every 1 week, 2 weeks, 1 month or 3 months.
- Task end date — at most 1 year from the date of the first task.
The app will create separate task occurrences according to the chosen frequency (e.g. every week) within the given date range. Each occurrence is an independent task and can be edited or deleted separately.
5.6 Marking a task as done
- Open the task list in the Tasks tab (from the apiary or hive level).
- Next to the chosen task, click the check icon / Done button (Fig. 70). The status will change from To do to Done.
Note
From the apiary level you can mark any task as done. From the hive level you can mark as done only a task that was added from that specific hive.
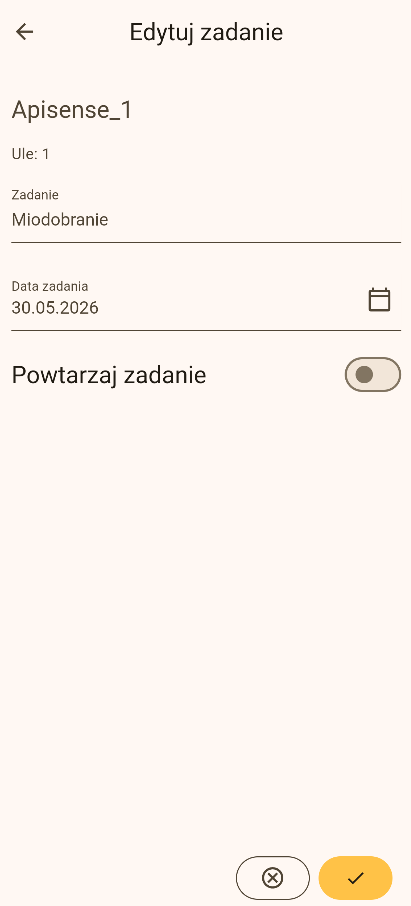
5.7 Editing a task
- On the task list, click the pencil icon next to the chosen task to open the Edit task view (Fig. 71).
- Update fields: Task, Task date, Repeat task.
- For a recurring task, choose the frequency (e.g. Every month) and fill in the Task end date (see 5.5 Repeating tasks).
- Save the changes with the yellow button in the bottom right corner.
Note
Tasks with scope Apiary or Selected hives can be edited and deleted only from the apiary level. From the hive level you will see such a task only as a read-only preview — with a grayed-out pencil icon.
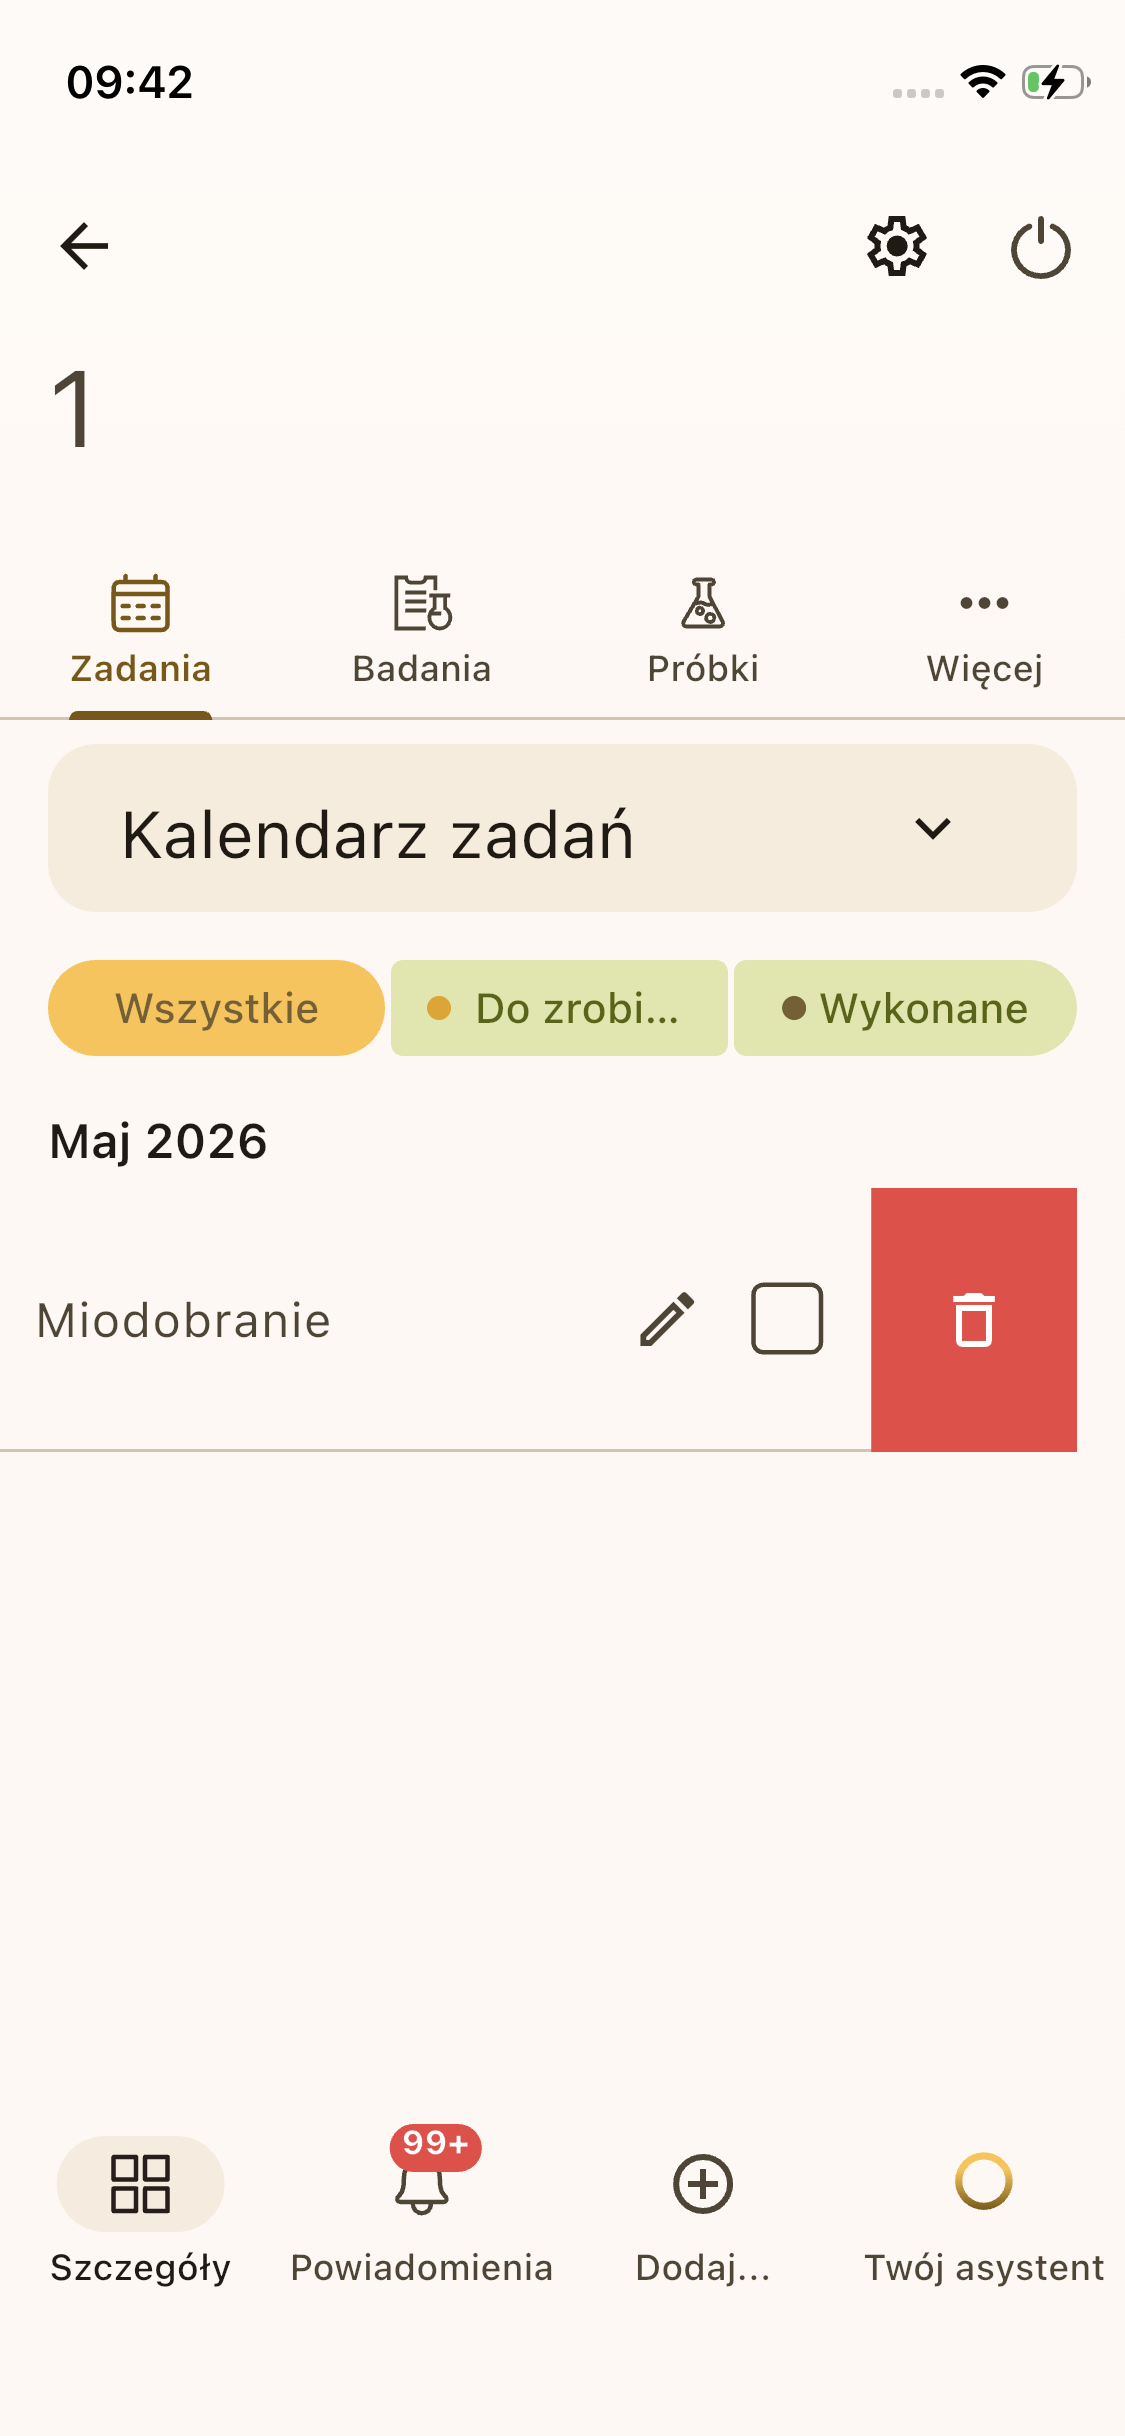
5.8 Deleting a task
- On the task list swipe the row with the chosen task to the left (Fig. 72).
- To delete the chosen task, click the bin icon on the red background.
Note
Tasks with scope Apiary or Selected hives can be edited and deleted only from the apiary level. Deleting such a task from the apiary level will automatically remove the related tasks from the view in all hives.
5.9 Task list and filtering
You will find the task list in the Tasks tab:
- From the apiary level — displays all apiary tasks: scope Apiary, Selected hives, and single-hive tasks belonging to that apiary (Fig. 73).
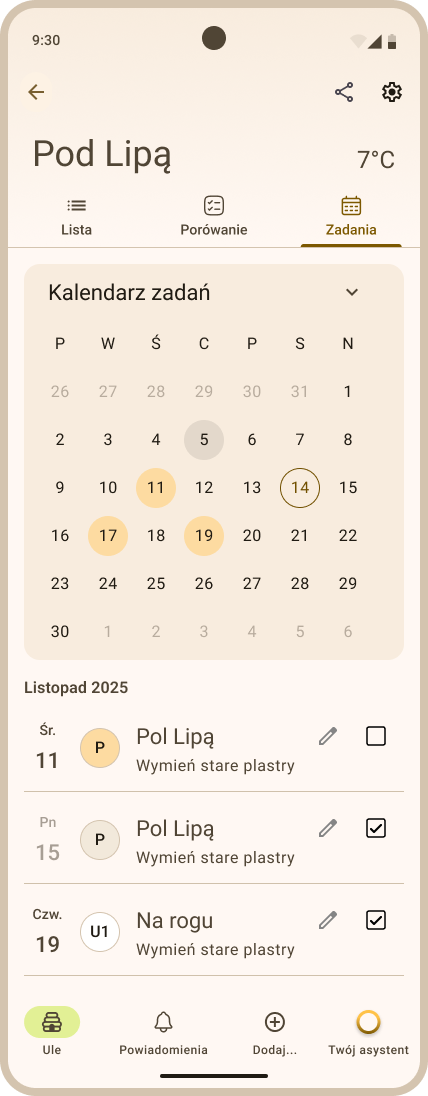
- From the hive level — displays the tasks visible in this hive: Apiary tasks, Selected hives tasks covering this hive, and Single hive tasks for this hive (Fig. 74).
You can filter the task list by status (All, To do, Done).
6. Disease alerts and the health questionnaire
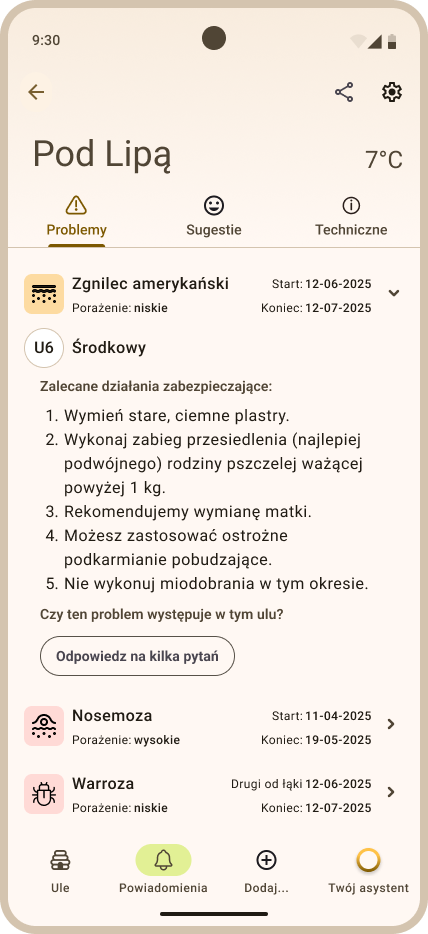
When the Apisense Pro AI system reports a threat (e.g. Nosema), alerts will appear in the Notifications tab in the app, along with a description and recommendations. By filling in the disease questionnaire (Answer a few questions), you provide feedback to the system and help tailor messages to the actual conditions in your apiary.
6.1 What do disease alerts mean?
Alerts in Notifications → Problems, as well as in hive Details (Details → Health section → Alert in colony), refer to diseases detected automatically by the Apisense Pro AI machine learning model based on sensor data and system analysis. This is not a veterinary diagnosis — the system signals a probable threat (e.g. varroa, nosema, foulbrood), together with severity level and recommended actions, which you will see after expanding the disease details (Problems tab).
On apiary and hive tiles, disease alerts appear as Threatened status or the name of the detected disease (sometimes with a “+N” badge when more than one threat was found in the hive).
The model is highly accurate, but — like any predictive analysis — it can sometimes be wrong. Therefore it is worth checking every alert in the field and completing the disease questionnaire (Problems → disease details → Answer a few questions). Filling in the form is very important because your answers help improve the model and increase disease detection accuracy. Thanks to this feedback, the system can better recognize real cases and reduce false alarms.
It is also worth remembering that the model can detect signs of disease at a very early stage, when symptoms may not yet be visible or may be hard to notice during a standard inspection. Therefore, even if you do not see clear symptoms at first glance, it is worth checking the hive indicated in the alert and providing feedback through the form.
6.2 What to do when the disease is not present in the hive
If after visiting the apiary you conclude that the disease is not actually present in that hive:
- Open the alert details (Notifications → Problems → the disease row).
- Click Answer a few questions.
- For questions about symptoms, answer No (you can attach photos from the inspection to each question).
- Submit the form by clicking Save.
Your answers help the system better tailor future messages to conditions in your apiary. You can fill in the questionnaire again for the same disease episode after a few days if the model still detects the disease.
The Skip option lets you move on without answering a given question — it is still worth completing at least part of the form, especially when you are unsure about the alert.
6.3 Filling in the disease questionnaire from the apiary level
- In the Apiaries tab (the start view after logging in to the Apisense app) click the tile of the apiary in which a threat was detected (red bee icon and "Threat" label on the apiary tile). After clicking the tile, the Hives view will be displayed (Fig. 75).
- Then choose the Notifications tab from the bottom menu. As a result, the Problems tab will be displayed, and in it a list of current and historical problems detected in this apiary (a list of diseases from all hives in the apiary, Fig. 77).
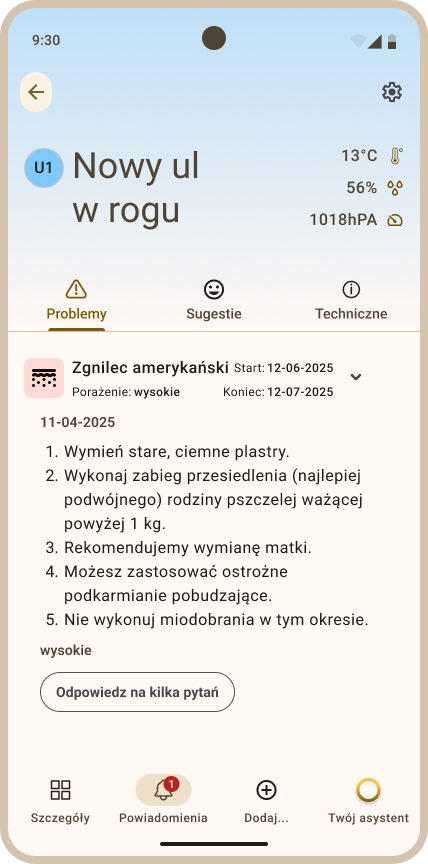
- Go to the details of the detected disease by clicking the row with the disease, e.g. American foulbrood (Fig. 78). After going to the details, you will see the duration of the disease, its severity level, recommended protective actions and the Answer a few questions button (the Recommendations tab), as well as previously given answers (the Answers tab).
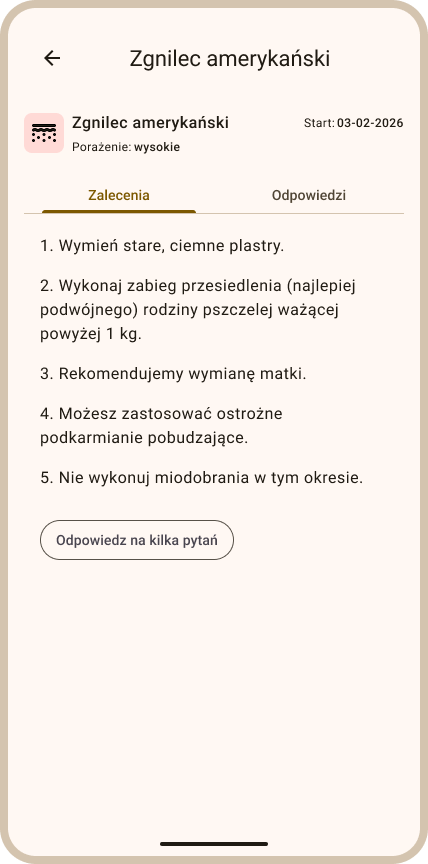
- To fill in the disease questionnaire for an alert detected by the system, click the Answer a few questions button. After clicking the button, the Answer a few questions view will be displayed (Fig. 79). Then answer all the questions, choosing one of the available options: Yes, No or Skip — depending on what you observed in the hive.
- You can also attach photos or recordings to your answers to individual questions. To do so, click the + button in the upper right corner of the Answer a few questions view (Fig. 80).
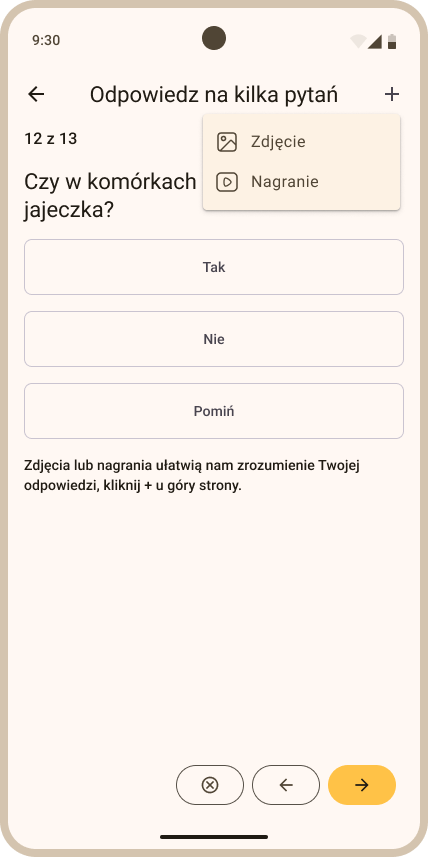
-
To proceed to the next question, click the yellow right-pointing arrow icon in the lower right corner of the screen.
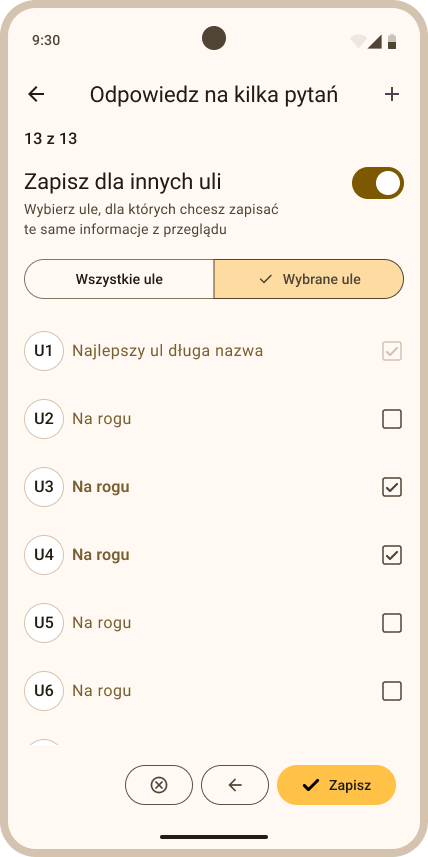
-
To save your answers and submit the form, click the yellow Save button in the lower right corner of the last screen of the Answer a few questions view (Fig. 81).
6.4 Filling in the disease questionnaire from the hive level
- In the Apiaries tab (the start view after logging in to the Apisense app) click the tile of the apiary in which a threat was detected (red bee icon and "Threat" label on the apiary tile). After clicking the tile, the Hives view will be displayed (Fig. 82).
- Click the tile of the hive in which a threat was detected. After clicking the tile, the Details tab of the hive will open (Fig. 84).
- Then choose the Notifications tab from the bottom menu. As a result, the Problems tab will be displayed, and in it a list of current and historical problems detected in this hive only (Fig. 85).
- Go to the details of the detected disease by clicking the row with the disease, e.g. American foulbrood (Fig. 86). After going to the details, you will see the duration of the disease, its severity level, recommended protective actions and the Answer a few questions button (the Recommendations tab), as well as previously given answers (the Answers tab).
- To fill in the disease questionnaire for an alert detected by the system, click the Answer a few questions button. After clicking the button, the Answer a few questions view will be displayed (Fig. 87). Then answer all the questions, choosing one of the available options: Yes, No or Skip — depending on what you observed in the hive.
- You can also attach photos or recordings to your answers to individual questions. To do so, click the + button in the upper right corner of the Answer a few questions view (Fig. 88).
-
To proceed to the next question, click the yellow right-pointing arrow icon in the lower right corner of the screen.
-
To save your answers and submit the form, click the yellow Save button in the lower right corner of the last screen of the Answer a few questions view (Fig. 89).
7. Registering a sample
- In the Apiaries tab (the start view after logging in to the Apisense app) click the apiary tile. After clicking the tile, the Hives view will be displayed (Fig. 90).
- Then click the tile of the hive for which you want to register a sample. As a result, the Hive details view will be displayed (Fig. 92).
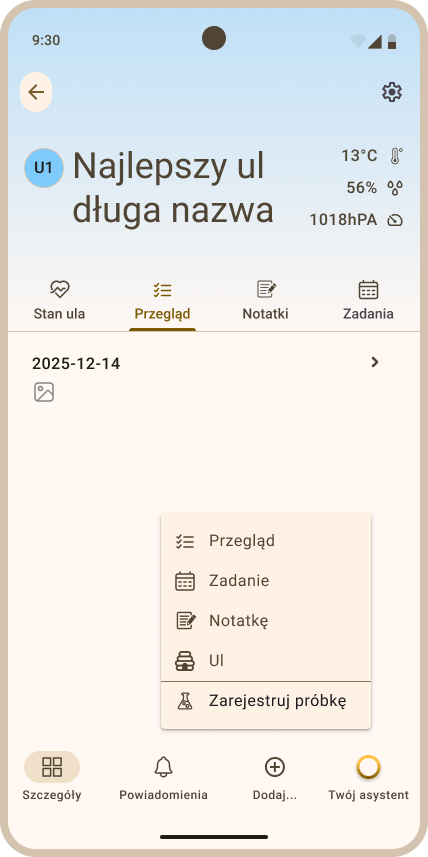
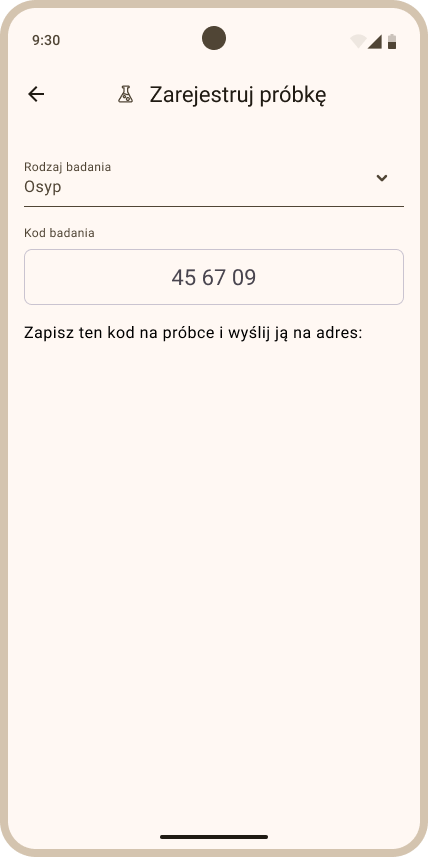
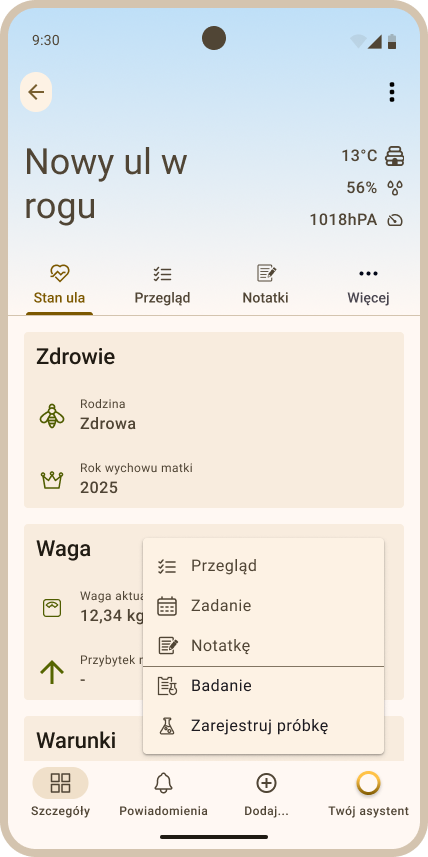
- To register a sample, choose the Add... option from the bottom menu, then Register sample (Fig. 93); the Register sample view will be displayed (Fig. 94). Note: the Register sample option is only available for hives with a linked Apisense VitalSensor device.
-
In the Register sample view, fill in the following fields:
-
Sample collection date - enter the date when you collected the sample (current by default).
-
Test type - select the appropriate item from the drop-down list, e.g. Dead bees.
-
After filling in the above fields, the yellow Generate code button will be displayed. Click that button and a special code will be generated in the Test code field, which should be written on the sample (Fig. 94). The sample prepared this way with the code should then be sent to the following address: University of Life Sciences in Lublin, ul. Doświadczalna 54, 20-280 Lublin.
How to perform the test yourself?
Detailed instructions for sample collection and field testing (Nosema microscopy, Varroa sugar roll, colony health questionnaire) are available in the Lab procedures section.
8. Tests
8.1 Adding a test
- In the Apiaries tab (the start view after logging in to the Apisense app) click the apiary tile. After clicking the tile, the Hives view will be displayed (Fig. 95).
- Then click the tile of the hive for which you want to add a test. As a result, the Hive details view will be displayed (Fig. 97).
- To add a test, choose the Add... option from the bottom menu, then Test (Fig. 98); the Add test view will be displayed (Fig. 99).
-
In the Add test view (Fig. 99), fill in the following fields:
- Test date — choose the date the test was performed.
- Test type — choose one of the available options from the drop-down list, e.g. Mite drop.
- Photos and supplementary information — after choosing the test type, take or upload the required number of photos and fill in the numeric fields according to the on-screen prompts.
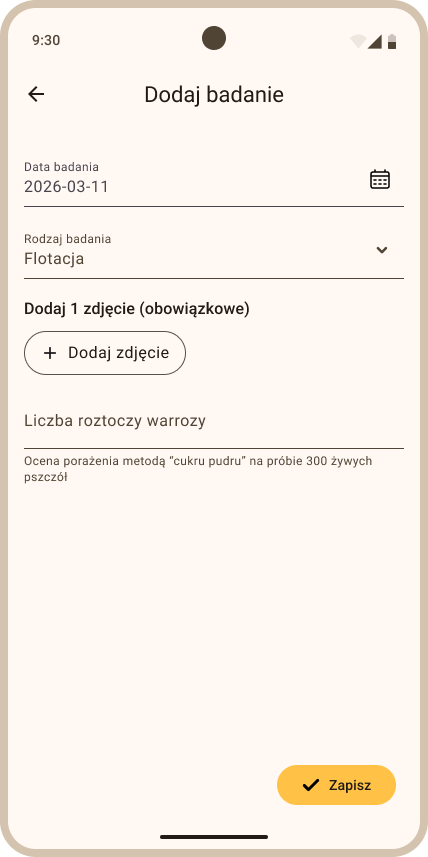
- Save the test using the yellow save button in the lower right corner of the screen. The saved test will be displayed in the test list under Hive details > More (top menu) > Tests (Fig. 100).
Main system panel
1. Apiary list overview (Apiaries tab)
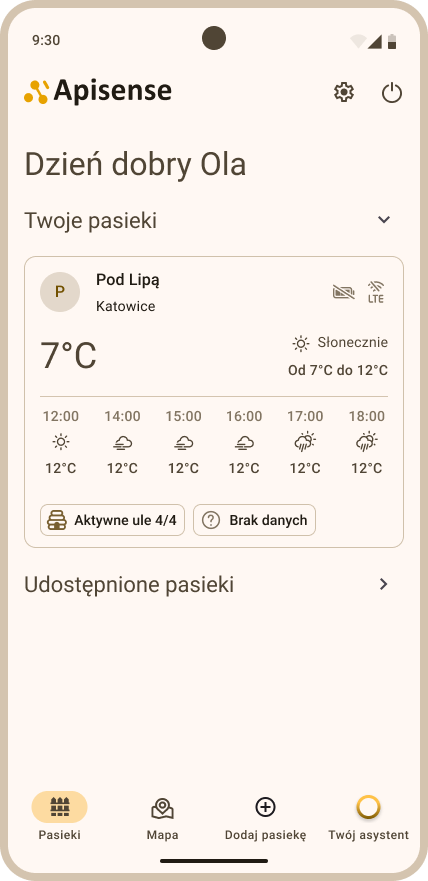
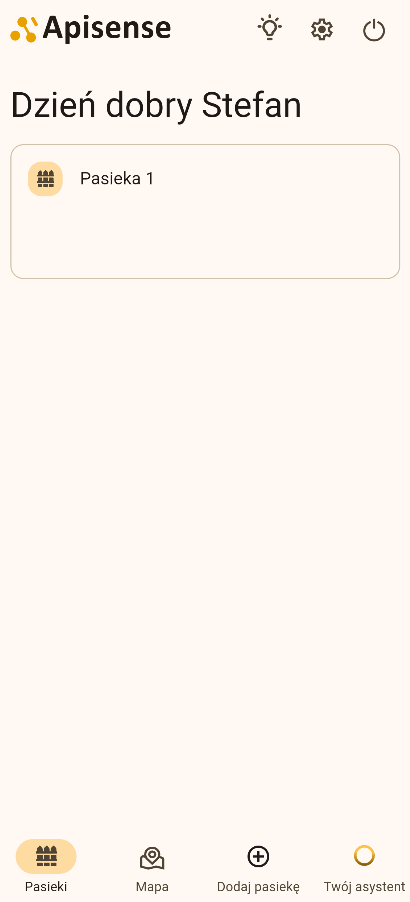
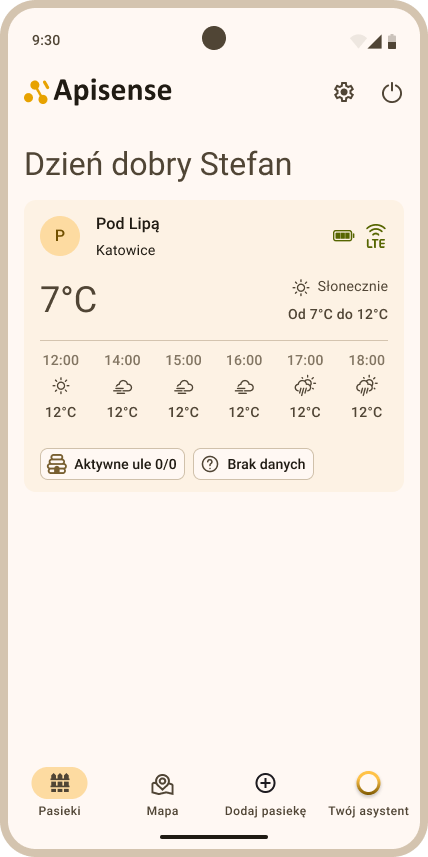
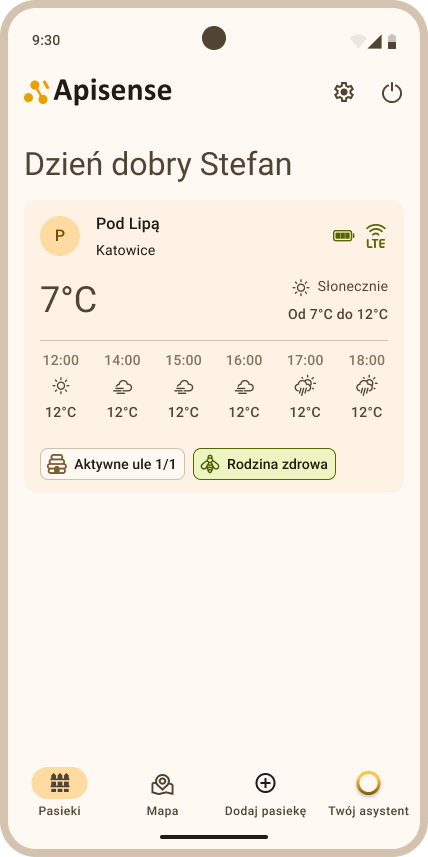
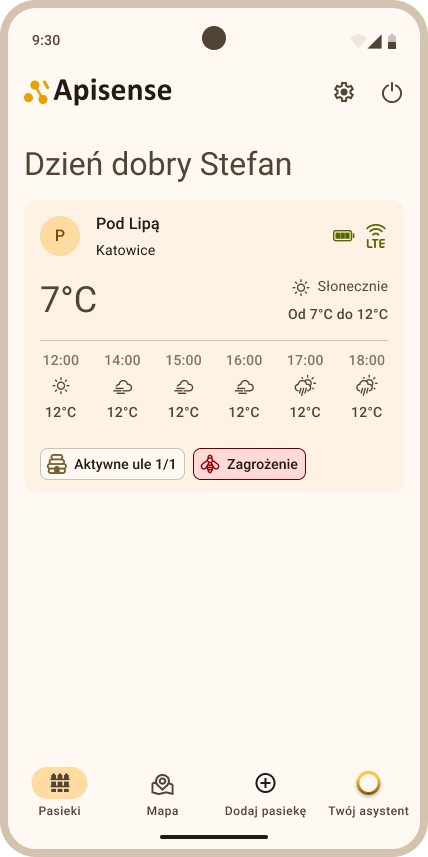
The Apiaries tab is the basic tab in the Apisense app, which you will see right after logging in to the system (Fig. 101).
Most important information:
-
The Apiaries tab contains all of your apiaries.
-
Each apiary is presented in the form of a single, clear tile containing key, appropriately aggregated information.
-
Apiary tiles are presented in a clear form.
-
The following information is displayed on each apiary tile:
-
apiary name with its abbreviation,
-
Apisense Hub battery level,
-
Apisense Hub LTE signal level,
-
current weather,
-
number of active hives - the number of hives that have at least one device (Scale, VitalSensor) communicating correctly with the Apisense Hub,
-
bee colony status - indicating whether the colony in the apiary is fully healthy or whether a threat has been detected in any hive,
More information on interpreting the individual statuses can be found in chapter 7. Interpretation of statuses, measurements, icons, colors at individual stages
-
-
Clicking the apiary tile opens the apiary interior - the hive list (Hives tab).
2. Apiary map overview (Map tab)
The Map tab presents the locations of all apiaries the user has access to on a map (Fig. 102). The map makes logistics easier, helps plan visits and quickly locate apiaries that require intervention.
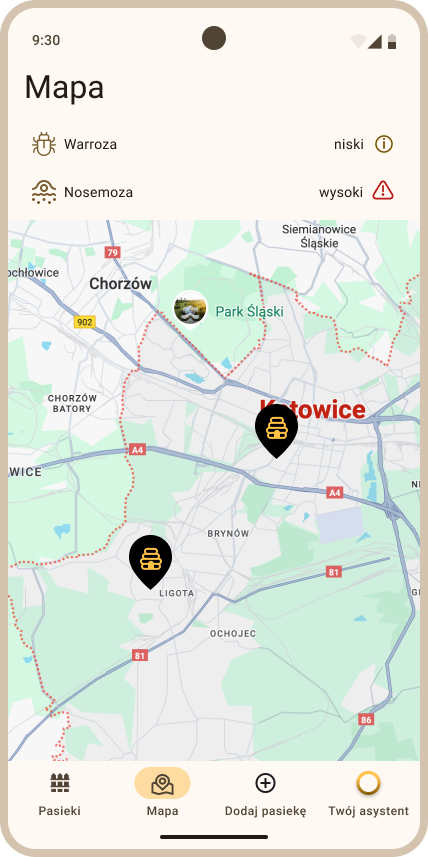
Most important information:
- To go to this tab, click the Map option visible on the bottom menu right after logging in to the Apisense app.
- Markers showing the user's apiary locations are displayed on the map.
- The map view can be filtered by problems detected in the apiaries. To do so, click an option such as Varroa above the map; the map view will be limited to only those apiaries where this disease threat is present.
3. Hive list overview (Hives tab)
In the hive list you will find all the hives that have been assigned to the chosen apiary. You can go to the Hives tab directly from the Apiaries tab by clicking the tile of the chosen apiary.
3.1 Hive list
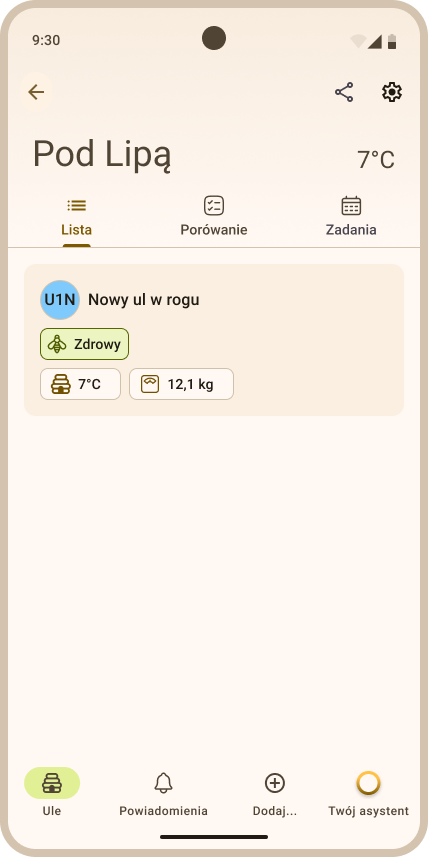
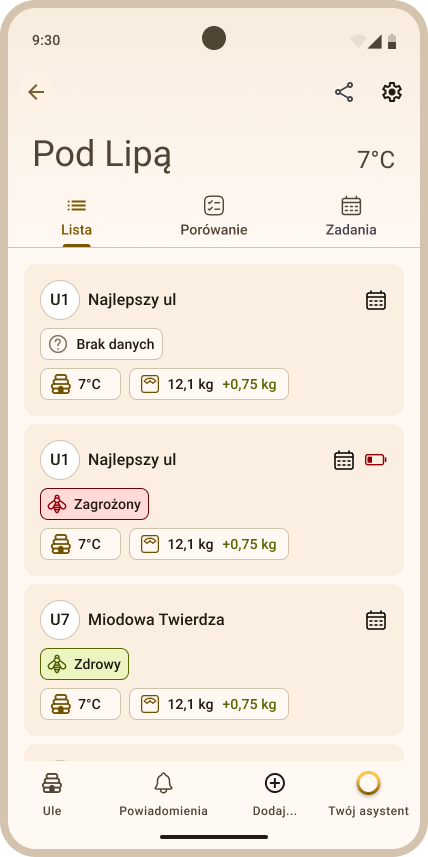
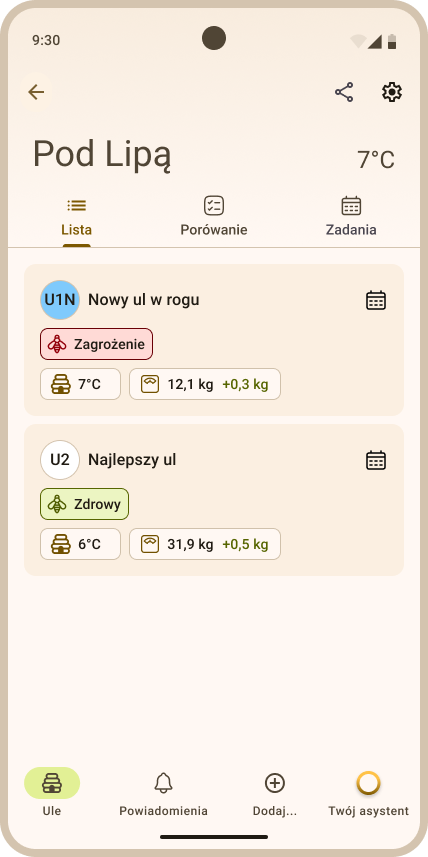
In the List tab you will find a list of all hives assigned to the chosen apiary (Fig. 103). This layout lets you quickly compare hives and locate those that require attention.
Most important information:
-
Just like apiaries, each hive is presented as a separate tile.
-
Each hive tile consists of the following elements:
-
hive name with an icon in the color corresponding to the year the queen was raised,
-
bee colony status - indicating whether the colony in the given hive is healthy or whether a threat has been detected,
-
current temperature inside the hive,
-
current hive weight together with honey gain,
-
additional icons related to specific events in the hive, e.g. a red battery icon indicating low battery level.
More information on interpreting the individual statuses can be found in chapter 7. Interpretation of statuses, measurements, icons, colors at individual stages
-
-
Clicking the hive tile opens the hive interior - detailed measurement data taken by the devices assigned to the chosen hive (Details tab).
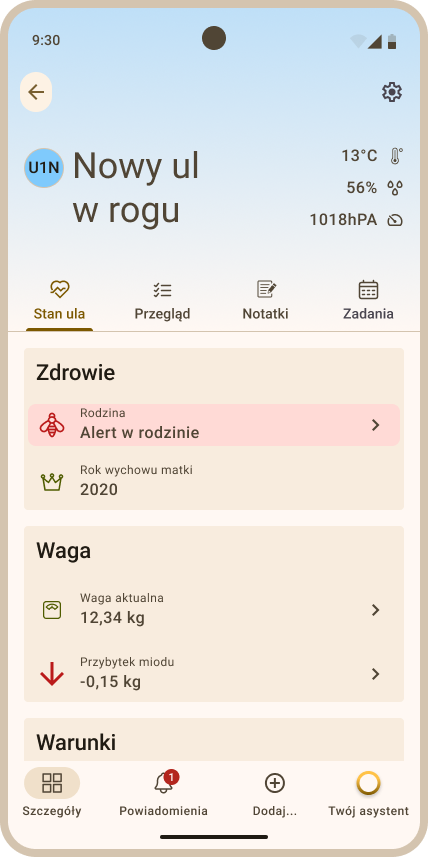
4. Hive contents overview (Details tab)
The hive Details view enables you to monitor measurement data coming from the measurement devices (Scale, VitalSensor) and to manage records relating to work on a specific hive (including inspections and notes). You can go to the details tab directly from the Hives tab by clicking the tile of the chosen hive.
The Details view is divided into several smaller tabs:
- Hive status
- Inspection
- Notes
- More:
- Tests
- Samples
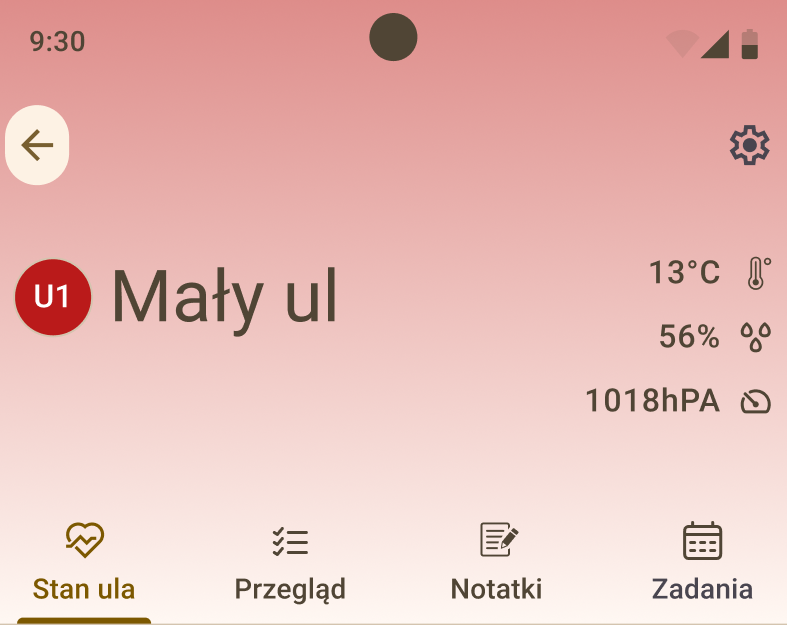
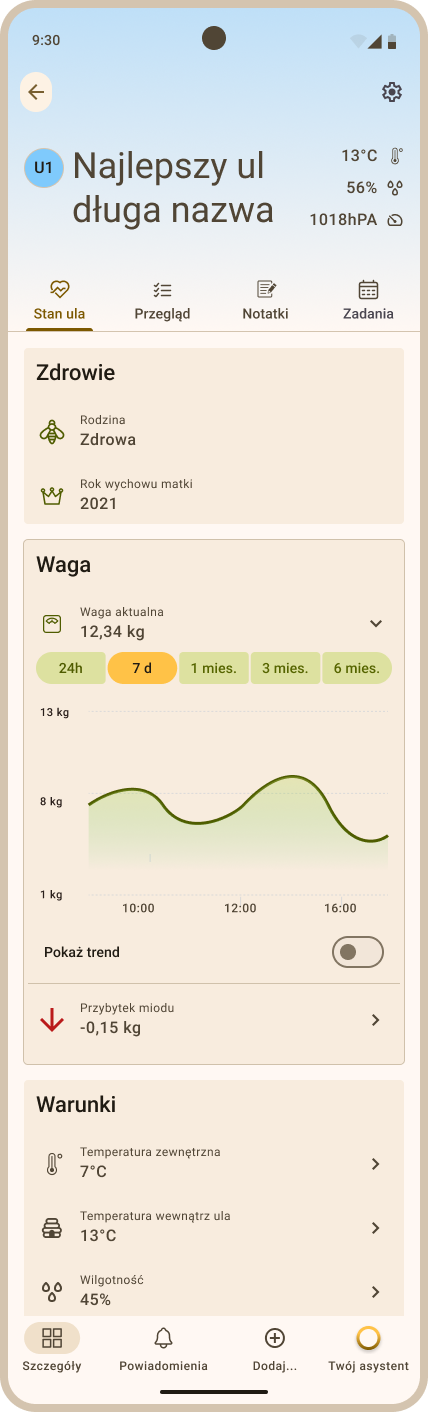
4.1 Hive status
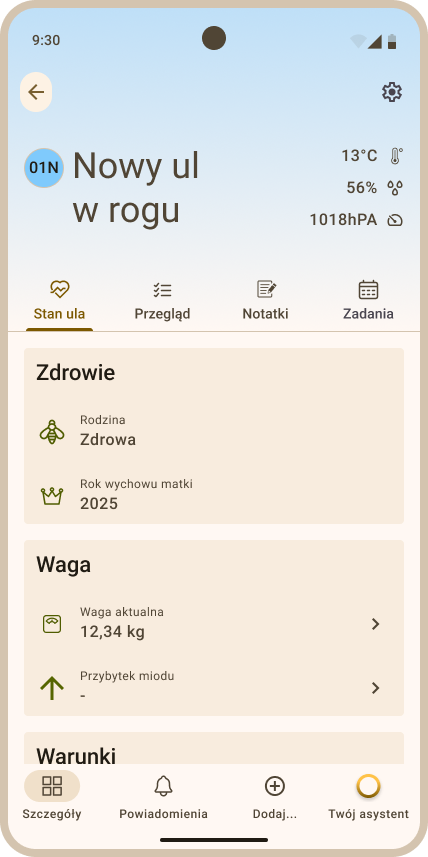
The Hive status tab presents the most important, current information about the condition of the bee colony and conditions inside the hive (Fig. 104), determined on the basis of measurement data from the monitoring devices.
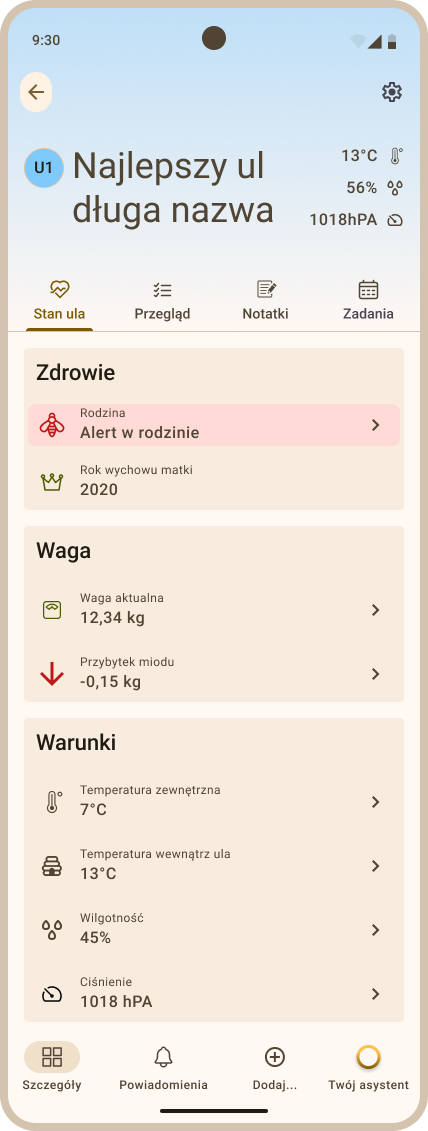
Most important information:
- Health section – presents the current status of the bee colony, indicating whether the colony is healthy or whether a potential threat in the form of a disease has been detected. This section also displays the year the queen bee was raised.
- Weight section – contains information about the current hive weight and honey gain, allowing you to assess production rate and bee colony activity.
- Conditions section – presents environmental data from inside the hive and its surroundings, such as outside temperature, inside temperature, humidity and pressure inside the hive.
- Detailed data and charts – after expanding individual elements in a given section, the user can see more detailed information and charts of parameter changes over time, which makes it easier to analyze the hive status and the conditions inside it.
More information about data analysis and presentation in chart form can be found in chapters Parameter monitoring and Data analysis and reports
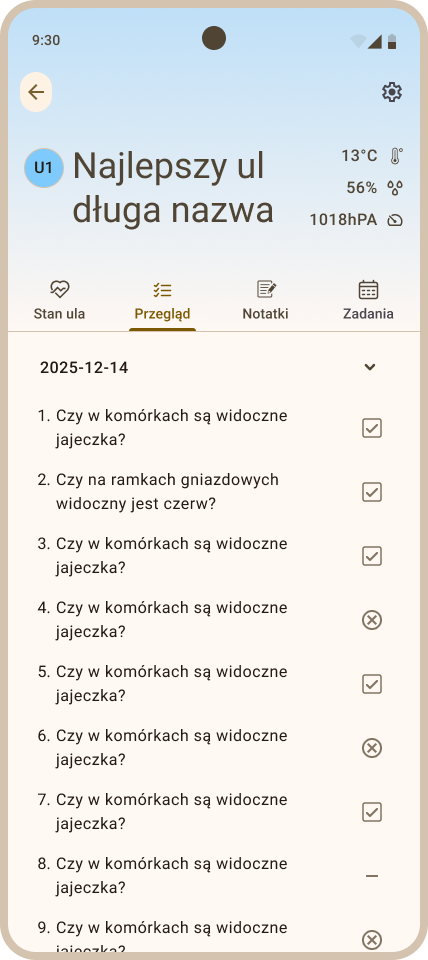
4.2 Inspection
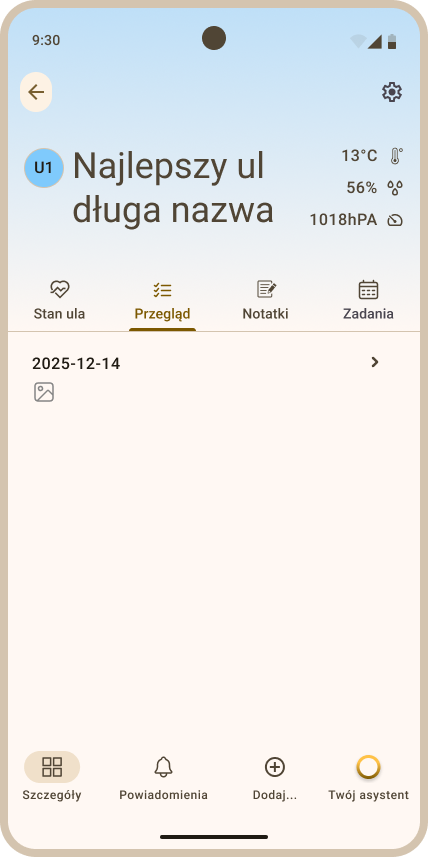
The Inspection tab enables you to review the history of inspections of a given hive. Inspections are presented as a list (Fig. 105).
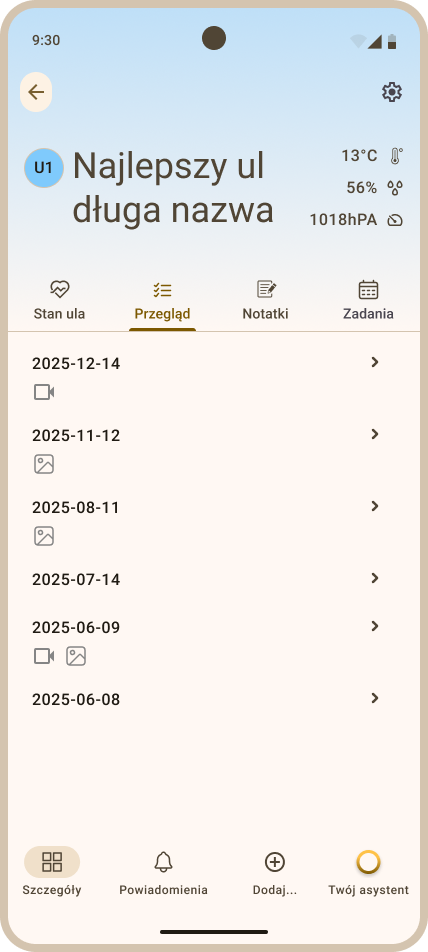
Most important information:
- Inspection list – presents a summary of all inspections performed for the chosen hive together with the inspection date.
- Multimedia materials – next to a given inspection, a photo or recording icon may be visible if visual materials were added during the inspection.
- Inspection details – after clicking the chosen row, detailed information about the inspection is displayed, including answers given during its performance.
4.3 Notes
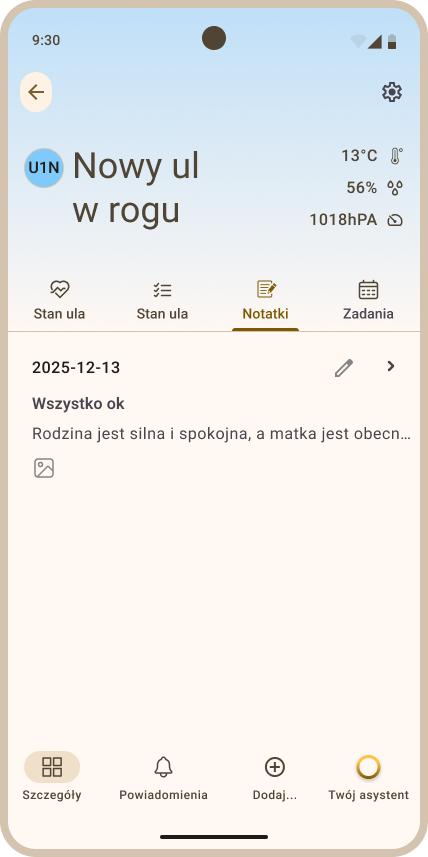
The Notes tab lets you save and review information about observations or events related to a given hive. Notes, like inspections, are presented as a list (Fig. 107).
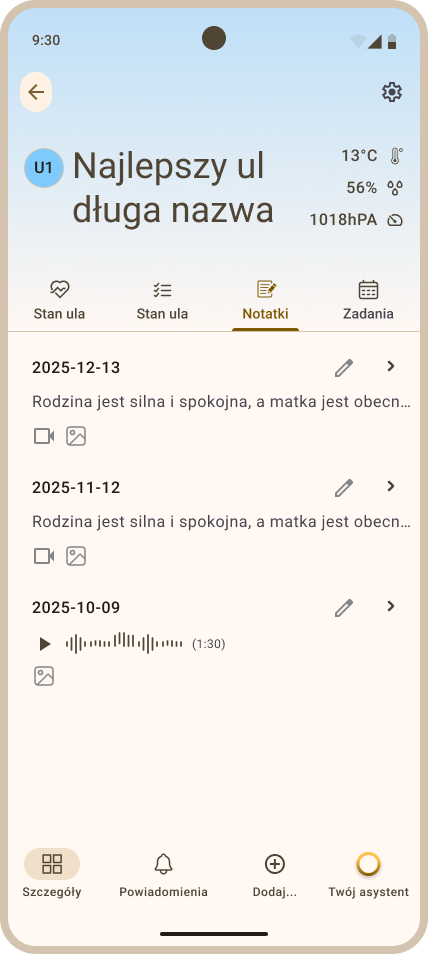
Most important information:
- Note list – presents all notes saved for the chosen hive, containing the title/date and a shortened content fragment (if the note contains text).
- Additional materials – note items may also display photo, video recording or audio recording icons if such materials were attached to them.
- Note details – after clicking - expanding - the chosen note, the full note content is displayed together with the attached materials.
4.4 Tests
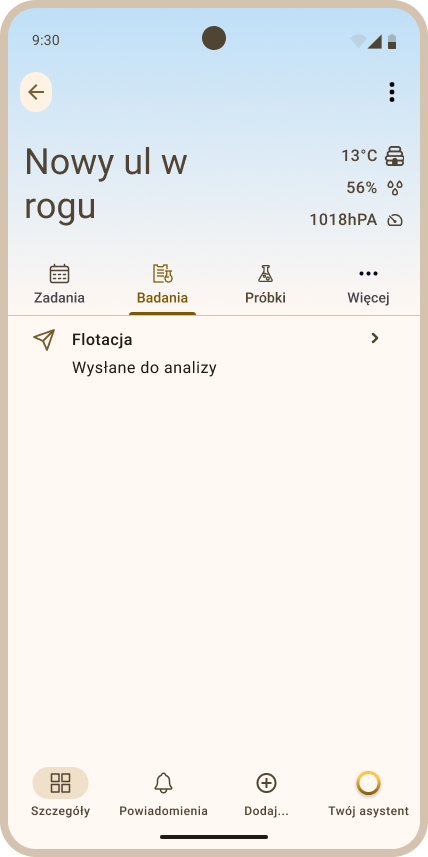
The Tests tab presents in a clear way a list of all performed and saved tests (Fig. 110) carried out for the chosen hive. Thanks to this, the user can quickly check the analysis history and return to earlier results.
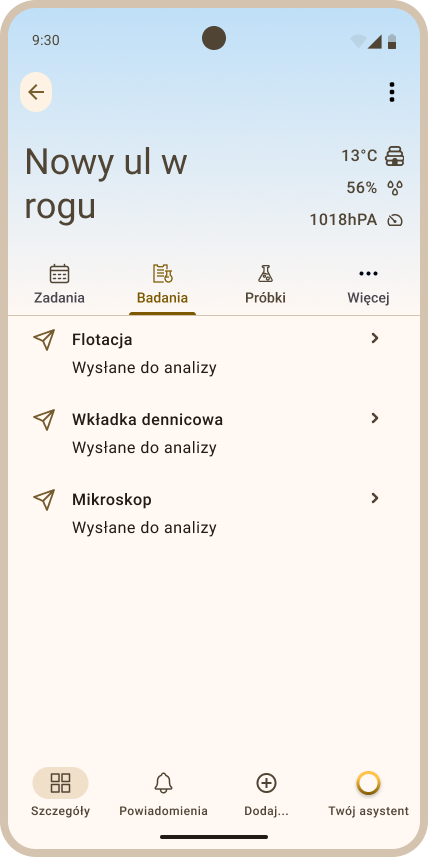
Most important information:
- Test list – presents all tests saved for the chosen hive, sorted in descending order by test date.
- Test details – after clicking a single test, its details are displayed, including: test date, test type and saved attachments.
4.5 Samples
In the Samples tab you will find a list of all registered samples for a specific hive (Fig. 110).
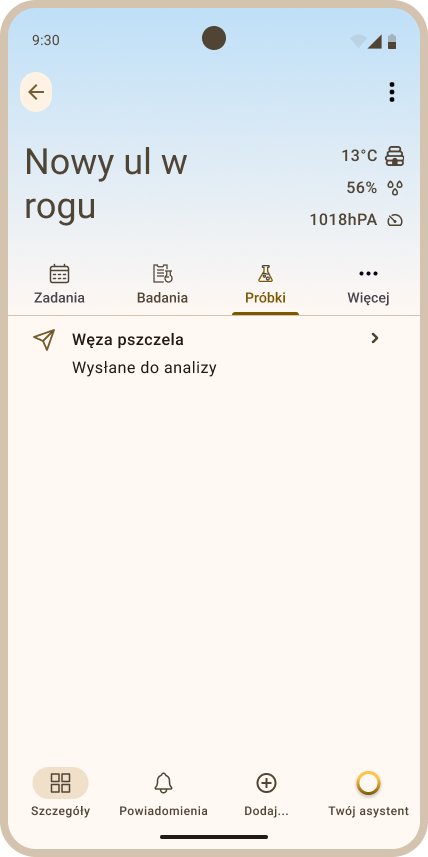
Most important information:
- Sample list – presents all samples saved for the chosen hive, sorted in descending order by sample collection date.
- Sample details – after clicking a single sample, its details are displayed, including: sample collection date, test type and the test code generated by the system.
5. Apiary settings overview
The Apiary settings view enables you to manage basic apiary data and to track information about the status of its equipment. You can access the view while in the Hives tab (the apiary interior) and clicking the cog icon in the upper right corner of the screen. The Apiary settings view consists of the following sections:
- Apiary details
- Hub
To see the contents of a given section, click its header; the full view with detailed information will be displayed.
5.1 Apiary details
The Apiary details section presents basic information identifying the apiary.
Most important information:
- Apiary name – the full apiary name, identifying it in the system, is displayed.
- Apiary name abbreviation – a shortened form of the name is presented, used in various views and reports.
5.2 Hub
The Hub section presents technical data of the Apisense Hub device, which is responsible for collecting measurement data from the hives in the apiary.
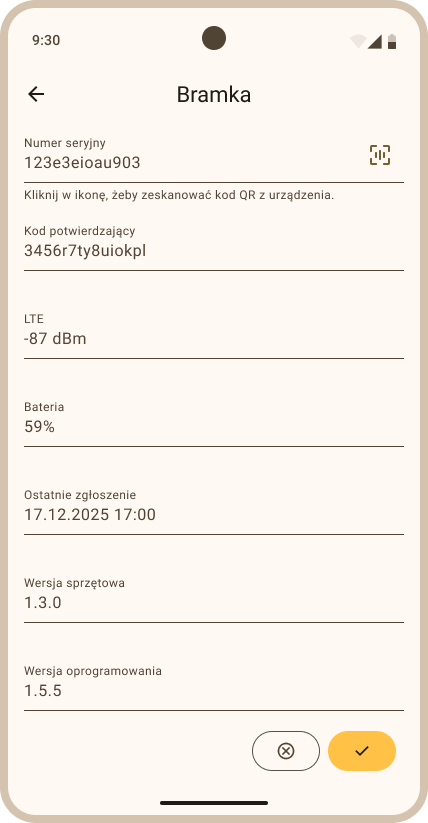
Most important information:
- Serial number and confirmation code – the device's unique serial number and the verification code confirming its assignment to the user are displayed.
- LTE and battery – information about the current LTE connection status and battery level of the Apisense Hub device is displayed.
- Last report – the date and time of the last communication of the Apisense Hub device with the system is displayed.
- Hardware and software versions – allows you to check the current hardware and software version of the Apisense Hub device.
6. Hive settings overview
The Hive settings view allows you to manage basic information about the hive, queen bee data and assigned measurement devices. You can access the view from the hive Details tab (the hive interior) by clicking the cog icon visible in the upper right corner of the screen. The Hive settings view is divided into the following sections:
- Hive details
- Queen information
- Equipment
To see the contents of a given section, click its header; the full view with detailed information will be displayed.
6.1 Hive details
The Hive details section presents basic information identifying the hive and its construction.
Most important information:
- Hive name – the full hive name making it easy to identify in the system.
- Maximum number of frames in the brood box – information about the maximum number of frames that can fit in the hive's brood box.
- Hygienic bottom board – information about whether the hive has a hygienic bottom board.
6.2 Queen information
The Queen information section enables you to review detailed data about the queen bee in the hive. Click the chosen header to display the details.
Most important information:
- Year the queen was raised – presents the year the queen bee hatched.
- Queen origin – information about the queen's origin, e.g. own breeding.
- Insemination method – indicates the method of queen insemination, e.g. natural.
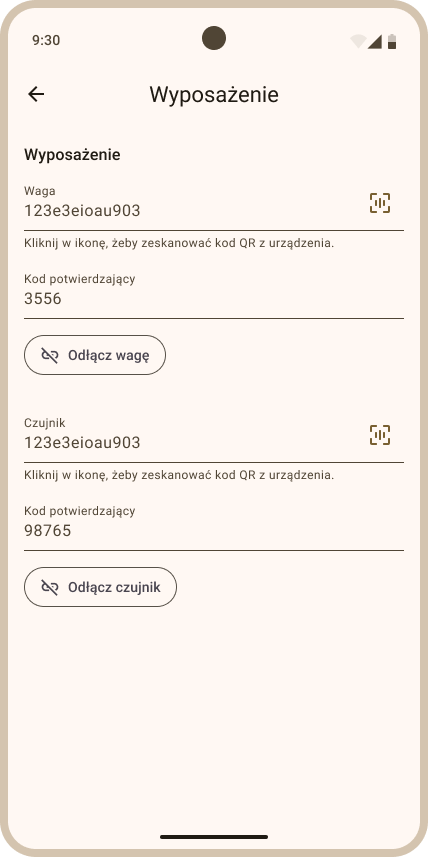
6.3 Equipment
The Equipment section presents the measurement devices assigned to a given hive and their current status.
Most important information:
-
Serial number and confirmation code – the unique serial numbers and verification codes of the Scale and VitalSensor measurement devices.
-
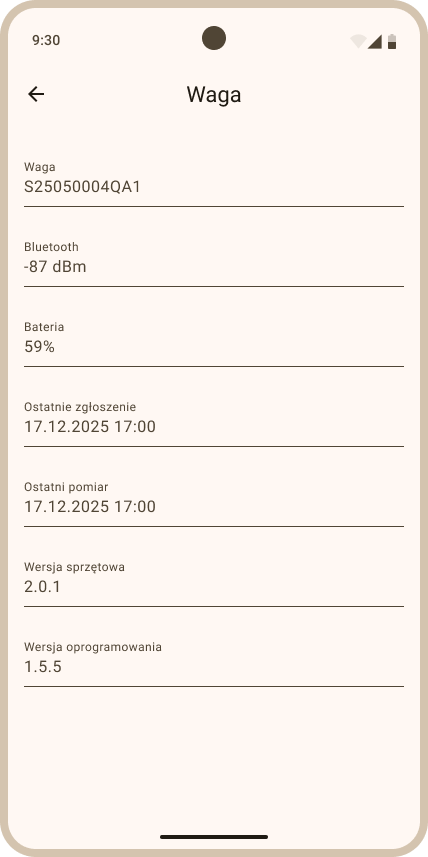
Expand details – clicking the chosen device (VitalSensor/Scale) opens the full view with information about the equipment status in the hive (Fig. 117).
-
Device details – after clicking a given device, the following are displayed:
- BLE and battery – information about the current BLE signal strength and the device's charge level.
- Last report – the date and time of the device's last communication with the Apisense Hub.
- Last measurement – the date and time of the latest measurement taken by the device.
- Hardware and software versions – allows you to check the current hardware and software version of the Apisense Scale/Apisense VitalSensor device.

7. Interpretation of statuses and icons used in the system
The system uses various statuses and icons that make it easier to quickly recognize the state of the apiary, hives, measurement devices and planned activities. These elements serve as visual markers that allow the user to easily identify the most important information without having to analyze the data in detail.
This chapter presents the meaning of the individual icons, symbols and color coding used in the system interface, which will allow them to be interpreted correctly during daily work with the app.
First device startup
After creating an apiary with a Hub and assigning Scale/VitalSensor to a hive, before the devices connect to the system the tiles will show the following information:
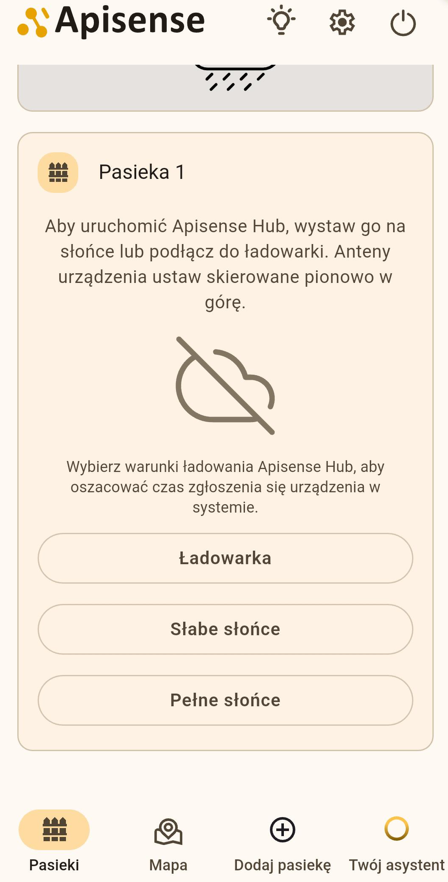
- Hub — apiary tile — on the apiary tile you will see a message with instructions to start the device and three buttons (Fig. 119) — choose the one that matches your situation:
| Option | Maximum wait time | When to choose |
|---|---|---|
| Charger | about 30 min | The Hub is connected to external power |
| Full sun | about 3 h | Hub placed in the sun with favourable sunlight |
| Weak sun | about 24 h | Discharged Hub with weak sunlight |
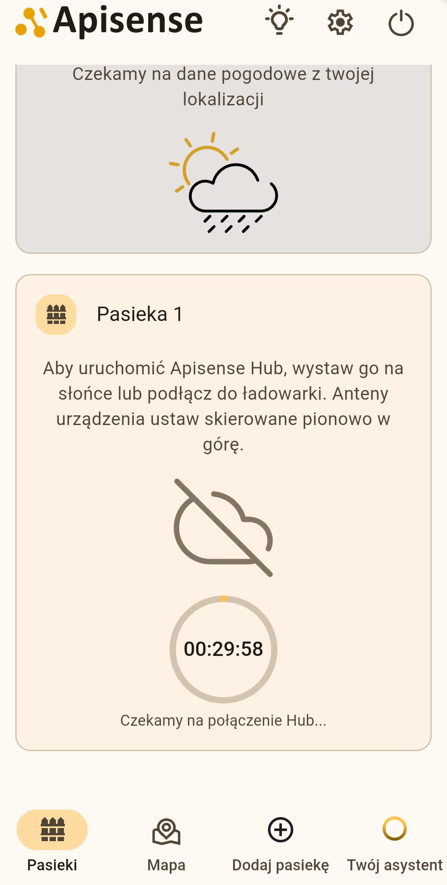
After you select an option, a countdown (timer) starts with the estimated maximum time to wait for the first connection (Fig. 120). This is an estimate, not a guarantee — a discharged Hub without access to light may need more time. If the Hub still does not report when the time elapses, the app will suggest trying again.
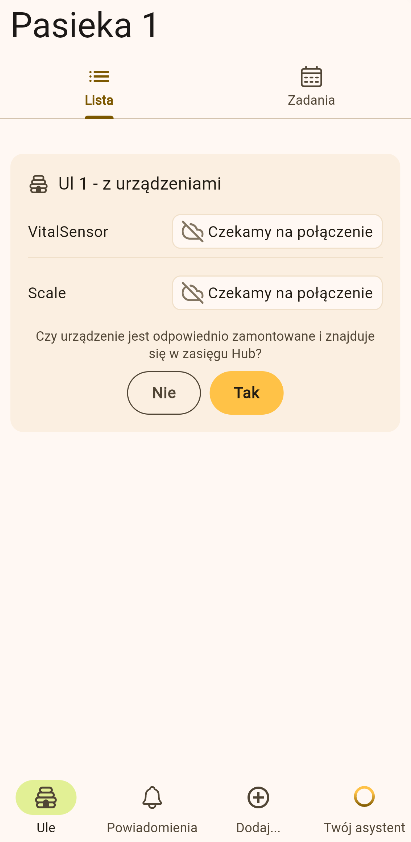
- Scale and VitalSensor — hive tile — on the hive tile you will be asked (Fig. 121) whether the device is mounted correctly and whether it is within Hub range (up to about 35 m). After you confirm, a timer starts with the estimated maximum time for the measurement device to establish communication with the Hub (Fig. 122).

Additional messages on the apiary tile
After the devices report for the first time and the first data appear, the apiary or hive tile may still not show full information. Some data will only become visible after a few days:
| Message | Meaning |
|---|---|
| Waiting for weather data from your location | The Hub is online, but the weather forecast is not yet available. The forecast should appear on the next day after stable Hub communication. |
| Collecting health data for X of Y hives | See Colony health. |
Colony health status
Colony health icons inform about the condition of bee colonies in individual hives and across the apiary. Health assessment is based on VitalSensor data and the AI model.
| Icon | Where it appears | Meaning |
|---|---|---|
 |
apiary tile (Apiaries tab) | Healthy colony |
 |
apiary tile (Apiaries tab) | Threatened — the bee colony in this apiary is threatened. A disease threat was detected in at least one hive in this apiary that is outside the Collecting data period. |
 |
apiary tile (Apiaries tab), hive tile (Hives tab) | Collecting data on the apiary tile — means that all VitalSensor devices in the apiary are in the colony health data collection period (first ~3 days after assignment); the first AI analysis is in progress — the system is collecting data, but the model does not yet have enough history to reliably assess colony health. Collecting data on the hive tile — appears on a hive with an assigned VitalSensor that is in the colony health data collection period (analogous to the apiary case). |
 |
apiary tile (Apiaries tab) | Collecting health data for X of Y hives… — means that at least one hive in the apiary has a VitalSensor that is still in the colony health data collection period. Example: there are 5 hives in the apiary; 4 of them have had a VitalSensor for a longer time and each indicates a healthy colony. A VitalSensor was assigned to the 5th hive today. On the apiary tile you will see a smaller Healthy colony chip and the message Collecting health data for 1 of 5 hives. |
| No health status chip | apiary tile (Apiaries tab), hive tile (Hives tab) | Apiary without a Hub, or apiary with a Hub but no VitalSensor devices in any hive in this apiary. The system has no basis to assess colony health. |
 |
hive tile — Colony state row, Hive status tab in Details | Healthy — VitalSensor outside the data collection period; the model detected no disease. The colony in this hive is considered healthy. |
 |
hive tile (Hives tab) | Disease name on a yellow background — disease detected at low/moderate infestation level. Disease name on a red background — disease detected at high infestation level. +N next to the disease name — means that more than one disease was detected in the hive. |
 |
apiary tile (Apiaries tab), hive tile (Hives tab) | No data — means that the system cannot assess the health of the bee colony (on the hive tile this concerns data from a specific VitalSensor; on the apiary tile it refers to all VitalSensor devices in this apiary). For example, it may occur when a VitalSensor was in the data collection period but suddenly stopped communicating with the Hub and the data were not collected and analysed by the AI model in time. |
 |
e.g. Details, Map | Disease icon — Varroa. Disease detected (Varroa) at low infestation level. |
 |
e.g. Details, Map | Disease icon — Nosema. Disease detected (Nosema) at high infestation level. Check recommendations in the Problems tab. |
Information icons
Information icons present information about apiaries and hives as well as data collected from measurement devices.
| Icon | Where it appears | Meaning |
|---|---|---|
 |
apiary tile (Apiaries tab) | Number of currently active hives out of the total number of hives in the apiary. A hive is active when it has at least one correctly communicating device. Example: There are 2 hives in the apiary. In hive 1, all devices have stopped reporting. In hive 2 only the Scale is reporting, but the VitalSensor is not. The icon will display: Active hives 1/2. |
 |
hive tile (Hives tab) | Current temperature inside the hive. |
 |
hive tile (Hives tab) | Current hive weight and daily honey gain. |
 |
hive tile (Hives tab) | Current hive weight and daily honey loss. |
 |
hive interior (Details tab) | Current temperature inside the hive. |
 |
hive interior (Details tab) | Current humidity inside the hive. |
 |
hive interior (Details tab) | Current atmospheric pressure inside the hive. |
Apisense device status
Apisense device status icons indicate the current operating status: connection quality and battery level of devices monitoring apiaries and hives.
| Icon | Where it appears | Meaning |
|---|---|---|
 |
apiary tile (Apiaries tab) | Very good LTE signal level of the Apisense Hub device. No action is required. |
 |
apiary tile (Apiaries tab) | Medium LTE signal level of the Apisense Hub device. No action is required. |
 |
apiary tile (Apiaries tab) | Very weak LTE signal level of the Apisense Hub device. The device may stop reporting. Reposition the device (Hub) if possible. |
 |
apiary tile (Apiaries tab) | The Apisense Hub device is not reporting (offline mode). Verify the cause of the offline state and take appropriate steps. |
 |
apiary tile (Apiaries tab) | Very high battery level of the Apisense Hub device. No action is required. |
 |
apiary tile (Apiaries tab) | Medium battery level of the Apisense Hub device. |
 |
apiary and hive tile (Apiaries, Hives tabs) | Very low battery level of the device (on the apiary tile this concerns the Hub; on the hive tile — Scale or VitalSensor). Charge (Hub) or replace the batteries (Scale, VitalSensor). |
 |
apiary tile (Apiaries tab), hive tile (Hives tab) | Unknown device battery level. Wait for the next device report. If the state persists for a long time, e.g. several hours (grey crossed-out battery icon, but current data such as temperature are displayed), report a problem in the app. |
| apiary tile (Apiaries tab), hive tile (Hives tab) | A full/high greyed battery icon means that the Hub or Scale/VitalSensor is not reporting, but the last known battery level was high. Check power and range; the device may have lost connectivity for reasons other than battery drain. | |
| apiary tile (Apiaries tab), hive tile (Hives tab) | Greyed battery icon with two bars — the last known battery level was medium. Lack of communication most likely results from BLE range issues (hives) or LTE (Hub). | |
| apiary tile (Apiaries tab), hive tile (Hives tab) | Greyed battery icon with one bar — the last known battery level was low. Device communication problems most likely result from a critically low battery level. Replace the batteries (Scale, VitalSensor) or charge the Hub. | |
 |
hive tile (Hives tab) | Awaiting connection — waiting for the device to contact the Hub. |
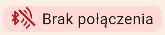 |
hive tile (Hives tab) | No connection — the device stopped communicating with the Hub. |
| hive tile (Hives tab) | Battery depleted — last known battery state: dead. Replace the device battery. |
Color coding
Color coding makes it easier to quickly recognize statuses, categories and important information in the system.
| Icon | Where it appears | Meaning |
|---|---|---|
 |
hive interior (Details tab) | The hive background color together with the icon (a colored circle) corresponds to the color assigned to the year the queen was raised. |
 |
various views including Notes, Inspections | The yellow color in the app means choice confirmation, the option to perform an action - often visible on buttons. |
 |
various views including Hive status | The red color in the app indicates the occurrence of a negative phenomenon, exceeding the expected parameter values, notifications and warnings (does not apply to the hive background in the Details tab). |
 |
various views including the hive tile | The green color in the app informs that everything is fine, indicates neutrality or a positive effect. |
Actions
Action icons enable you to perform available operations such as adding, editing or deleting data.
| Icon | Where it appears | Meaning |
|---|---|---|
 |
various views including charts | Toggle - choice inactive. |
 |
various views including charts | Toggle - choice active. |
 |
various views including adding notes etc. | Confirm or save the choice. |
 |
various views including adding notes etc. | Reject the entered data / Do not save. |
 |
including editing notes | Button enabling changes to be made for the chosen item. |
 |
including deleting notes | Button enabling deletion of the chosen item. |
Navigation
Navigation icons are used to move between views and app functions.
| Icon | Where it appears | Meaning |
|---|---|---|
 |
various views, including Apiaries tab - upper right corner of the screen | Button used to log out of the system. |
 |
various views - upper left corner of the screen | Button used to go to the previous view (Back button), e.g. from the Hives tab to Apiaries. |
 |
various views including disease questionnaire, Add inspection | Button used to go to the next view (Next button), e.g. moving on to the next inspection or disease questionnaire question. |
Parameter monitoring
The system enables continuous monitoring of the most important environmental and production parameters in the hive based on data collected by measurement devices. The analysis of this information allows you to assess the bee colony's condition, the conditions inside the hive and the dynamics of honey production on an ongoing basis. Regular observation of changes in individual parameters also makes it easier to detect irregularities early and to take appropriate action at the right time.
The data presented in the system can be displayed in the form of current values, charts of changes over time and summaries, which makes it easy to track trends and analyze bee colony behavior over a longer period.
1. Temperature
Temperature is one of the key parameters affecting the development and functioning of the bee colony. The system presents both the temperature inside the hive and the outside temperature, which allows you to compare the conditions in the hive with the ambient temperature.
Most important information:
- Sources: the VitalSensor measures temperature inside the hive; the Scale - the outside temperature next to the hive.
- Outside temperature allows you to analyze the influence of weather conditions on bee activity.
- Inside temperature reflects the conditions in the bee nest. A stable temperature indicates proper bee colony activity and adequate brood care. Typically 32–36°C in the cluster during the season.
- Sudden changes in inside temperature may indicate a weakening of the colony, the absence of a queen or other irregularities requiring hive inspection.
- Temperature charts allow you to observe changes over time and identify long-term trends.
2. Humidity
Humidity in the hive has a significant influence on brood development, honey ripening and the overall condition of the bee colony. Humidity that is too high or too low can negatively affect bee health and the quality of bee products.
Most important information:
- Inside humidity of the hive, measured by the VitalSensor, reflects microclimatic conditions in the nest.
- Humidity that is too high can promote disease development and worsen food storage conditions.
- Humidity that is too low can lead to drying of the brood and negatively affect bee colony functioning.
- Humidity chart analysis allows you to assess the stability of conditions in the hive and the effectiveness of ventilation.
3. Pressure
Pressure measurement in the hive lets you observe changes in inside conditions and their dependence on external factors such as weather changes.
Most important information:
- Pressure inside the hive, also measured by the VitalSensor, can change under the influence of weather conditions and bee colony activity.
- Pressure drops or rises can be a signal of upcoming weather changes, which often affect bees' flying activity.
- Pressure trend analysis combined with other parameters can help in interpreting bee colony behavior.
4. Weight
Hive weight measurement allows you to continuously monitor changes in hive mass, which result, among other things, from bee activity, nectar harvests, stores consumption or weather conditions.
Most important information:
- Current weight of the hive, measured by the Scale, represents the total mass of the hive together with the bee colony, stores and equipment.
- Weight changes over time allow you to observe the intensity of nectar flows and the activity of forager bees.
- Weight drops can indicate the use of stores, swarming or periods of weaker nectar flow.
- Weight chart analysis enables you to assess the dynamics of bee colony development, seasonal honey production and is key to planning honey harvesting.
5. Honey gain
The honey gain parameter shows the estimated amount of honey accumulated by the bee colony in a given period, based on changes in hive weight.
Most important information:
- Honey gain shows the rate of nectar accumulation and its processing by the bees.
- Positive values indicate a period of intensive nectar flow and active bee work.
- A decrease or lack of gain may mean the end of the nectar flow, unfavorable weather conditions or reduced colony activity.
- Gain trend analysis allows you to assess colony productivity and the optimal moment for planning honey harvesting.
Data analysis and reports
The data analysis module enables you to review and interpret the information collected by the system. Thanks to the visualization of data in the form of charts, the user can more easily observe changes in bee colonies in different time periods. Analytical functions allow you to spot important relationships more quickly, assess the effects of activities in the apiary, and make more informed decisions about its management.
1. Data visualization on charts
Charts allow for a clear presentation of changes in individual parameters over time. Thanks to them, the user can quickly identify characteristic patterns, sudden changes or periods of increased activity in the hive.
1.1 How to display a chart
To display the charts of individual parameters for the chosen hive (Fig. 124), follow this path in the app:
- From the Apiaries tab (the start view shown right after logging in to the Apisense app) go to the Hives tab. To do so, click the tile of the chosen apiary.
- From the Hives tab go to the Details tab. To do so, click the tile of the chosen hive.
- Make sure you are in the Details tab (highlighted in the bottom menu), Hive status sub-tab (underlined in the top menu). The charts are located in the Weight and Conditions sections.
- The chart will be displayed (Fig. 124) after clicking any header chosen from the sections listed above (e.g. Current weight from the Weight section).
1.2 Available charts
In the Apisense app, charts are available for the following parameters:
- hive weight
- honey gain
- outside temperature
- inside temperature
- humidity
- atmospheric pressure
1.3 Time frames presented on the charts
The data on the charts is presented in several time intervals. The last:
- 24 hours
- 7 days
- 1 month
- 3 months
- 6 months
To display a chart for the chosen range, click the corresponding time interval shown above the chart.
1.4 Chart interpretation
Charts allow you to observe changes in parameters over time and to analyze their interrelationships. Thanks to the visual form of data presentation, it is easier to notice repeating patterns, periods of stability or sudden deviations from typical values.
Chart analysis enables, among other things:
- assessing the dynamics of changes in the hive in different periods,
- identifying moments of increased bee colony activity,
- detecting unusual events or anomalies,
- observing long-term changes in the apiary.
Regular use of charts allows you to better understand the functioning of individual bee colonies and to react more quickly to emerging changes.
2. Trends
Trends enable analysis of the general direction of changes of a given parameter over time. This function helps to distinguish short-term fluctuations from long-term tendencies.
2.1 How to display a trend
Trends are available in the same section as the charts of individual parameters (Fig. 126). To display them, follow these steps:
- From the Apiaries tab (the start view shown right after logging in to the Apisense app) go to the Hives tab. To do so, click the tile of the chosen apiary.
- From the Hives tab go to the Details tab. To do so, click the tile of the chosen hive.
- Make sure you are in the Details tab (highlighted in the bottom menu), Hive status sub-tab (underlined in the top menu). Trends are located in the Weight and Conditions sections.
- Click the header with any parameter chosen from the sections listed above (e.g. Current weight from the Weight section).
- Below the chart there is a Show trend toggle, which is disabled by default. To display the trend on the chosen chart, click this toggle. After it is activated, an additional line will appear on the chart, showing the general direction of changes of the analyzed parameter.
2.2 Trend interpretation
The trend line shows the averaged direction of changes in a given period, which makes it easier to notice whether a given parameter's values:
- are rising,
- are falling,
- remain stable.
Trend analysis allows you to focus on long-term changes, ignoring short-term fluctuations resulting from the natural activity of the bee colony or temporary changes in conditions.
2.3 Benefits of trend analysis
Using trends in data analysis enables:
- a faster assessment of the general situation in the hive,
- early detection of irregularities,
- easier identification of long-term changes,
- better planning of activities in the apiary,
- more informed decision-making regarding the management of bee colonies.
Alerts, notifications and AI Assistant
The notification system in the app informs the user about important events in the apiary, the status of monitoring devices and recommended activities related to running the hives. The information is provided in the form of notifications and recommendations generated based on data from sensors, observations and system analysis. Thanks to this, the user can react more quickly to emerging problems and also make decisions about the further running of the apiary.
1. Notifications
Notifications generated by the system are available in the app — in the notifications section you can review messages and read their details.
1.1 Where to find notifications in the app
You can find notifications in the app by following these steps:
- From the Apiaries tab (the start view shown right after logging in to the Apisense app) go to the Hives tab. To do so, click the tile of the chosen apiary.
- From the Hives tab go to the Notifications tab. To do so, click the bell icon in the bottom menu, similar to the Hives tab.
- As a result, the Notifications view will open, with the Problems tab selected by default (Fig. 126).
- In addition to the Problems tab, you can also go to the Technical tab by choosing the appropriate option from the top menu.
1.2 Notification categories
Notifications in the app are available in the Notifications tab. Notifications are divided into the following categories that correspond to individual tabs (Fig. 126):
- Problems – notifications related to the health status of bee colonies, regarding detected diseases such as Varroa, along with recommended steps to combat the specific disease.
- Technical – notifications regarding the operation of monitoring devices, e.g. low battery level or no signal coverage.
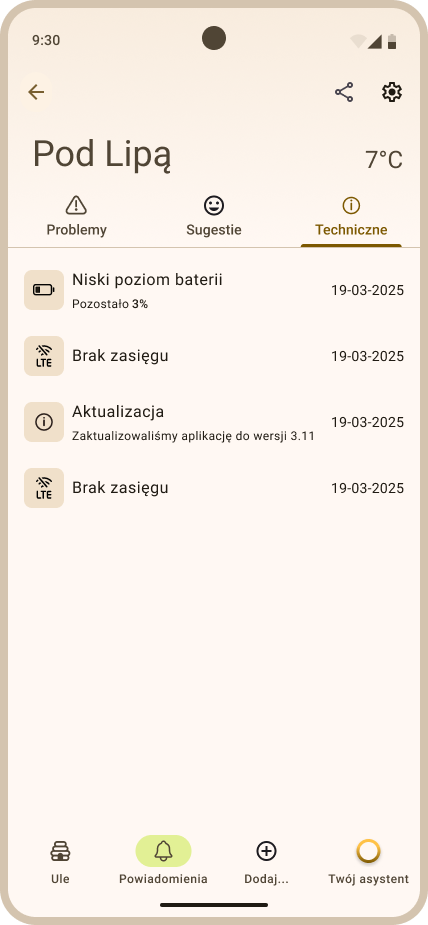
New notifications appear automatically on the appropriate list depending on their type. Unread messages are displayed in bold, while after they are opened they become slightly grayed out, indicating that they have already been read.
To display the details of a notification, click its header; this will expand the full message content.
2. Your AI Assistant
The AI Assistant is a feature that supports the user in analyzing the situation in the apiary and in interpreting the observed phenomena. Based on the information provided, the system generates answers and tips that can help in making decisions about running the apiary.
You can use the AI Assistant by asking questions in the app (Fig. 128).
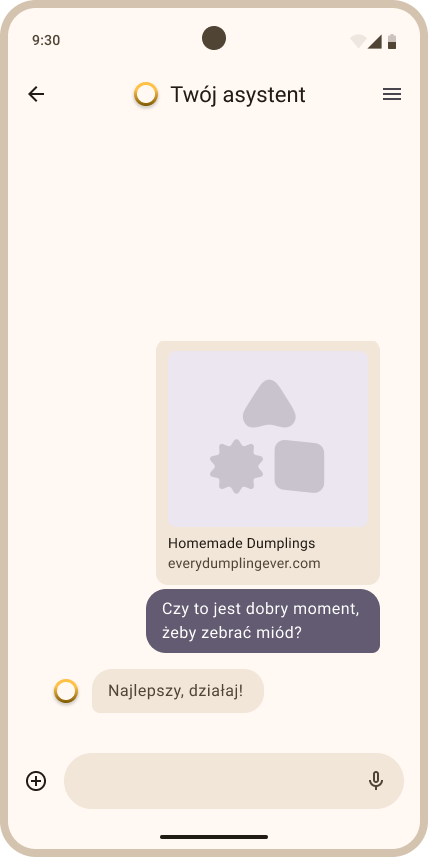
After submitting a question, the assistant analyzes the available information and generates an answer containing possible explanations of the situation or suggestions for further action.
You can use the AI Assistant by selecting the Your assistant tab from the bottom menu, available in the basic app views (Apiaries, Hives, Hive). Thanks to this, the user has quick access to assistant help at any time when using the system.
Reporting problems and suggestions
If while using the app you notice a bug, incorrect behavior of a feature, or have an idea for improving the system, you can report it directly from within the app. We also encourage you to submit proposals for new features that could make everyday work with the system easier.
Each report is reviewed by the team responsible for app development. User feedback helps identify problems faster, improve existing solutions, and develop features that best meet beekeepers' needs.
1. Reporting problems and suggestions in the app
To report a problem or suggestion in the app, follow these steps:
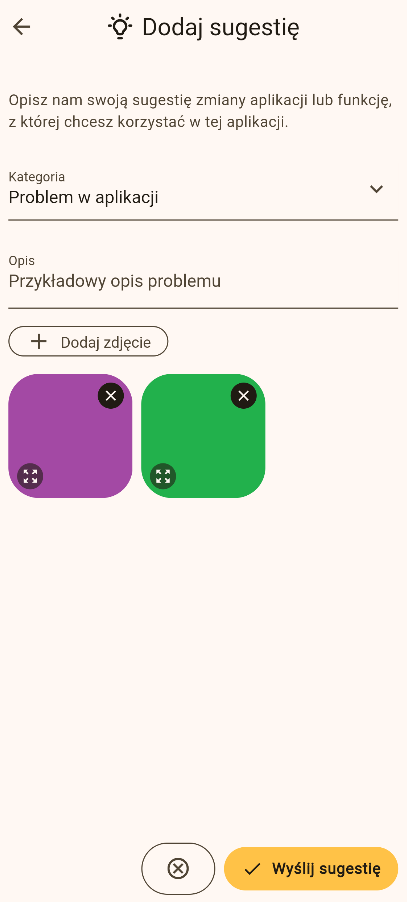
- Click the light bulb icon available from any view in the app, in the upper right corner of the screen (next to the settings and log out buttons). As a result, the Add suggestion view will open (Fig. 130).
-
In the Add suggestion view, fill in the following required fields:
- Choose category — select one of the available categories depending on whether you want to report a problem or suggest an app improvement.
- Description — enter a description of the problem or what you would like to change in the app.
-
Optionally, you can also attach photos to your report, which is especially useful when reporting a problem found in the app. Note: you can attach photos only — recordings are not accepted.
- After filling in the information above, click the yellow Send suggestion button in the lower right corner of the view to submit the report.
Account management
The user can review and modify their data, change account settings, and manage preferences regarding how the app works.
1. Editing user data
The user data editing feature enables you to update basic information assigned to the account, such as the displayed user name, contact details or password. Thanks to this, the user can manage their data on an ongoing basis and adjust account settings to their own needs.
1.1 Editing data
To edit user data:
- In the Apiaries tab (the Apisense app start view), click the cog icon in the upper right part of the screen. As a result, the Account settings view will open (Fig. 131).
- The Account settings view consists of several sections: Display name, Email, Mobile phone, Experience, Password and Language. Each one shows the user's current data.
- To change the contents of the chosen section, click its header; this will open a new view in which the data can be edited. For example, when changing the password, the user will be asked to enter a new password and to repeat it (Fig. 131).
- After making changes, save them by clicking the yellow button in the lower right corner of the screen.
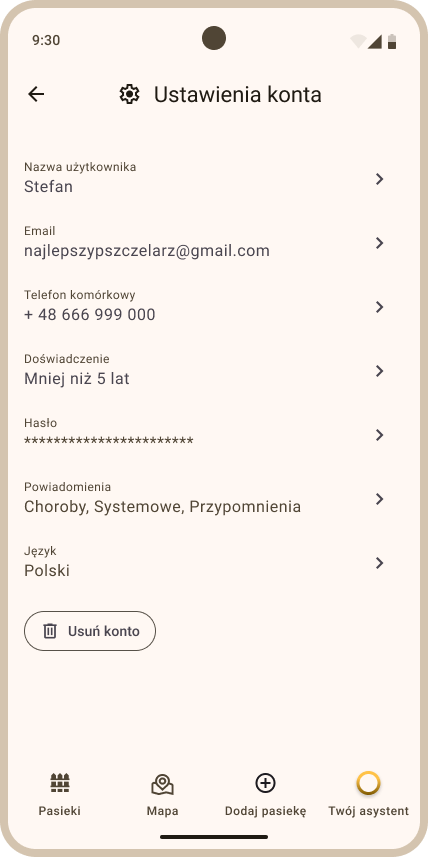
1.2 Deleting the account
In the lower part of the Account settings view (Fig. 131) there is also a Delete account button, which enables permanent deletion of the user account.
2. Checking the app version
To see which version of the Apisense app is currently installed on your device:
- Go to the Account settings view. To do so, click the cog icon in the upper right corner of the Apiaries tab.
- Scroll to the very bottom of the screen.
- At the bottom, in the central part of the screen, you will see an entry in the form Version X.Y.Z (e.g. Version 1.2.3) — that is the installed app version number.
It is worth comparing this number with the version available in Google Play or the App Store before reporting a technical issue.
System usage best practices
1. Daily panel use
- Regularly review the most important app views, in particular the apiary and hive list, to keep track of statuses and measurements on an ongoing basis. React to in-app alerts and notifications in a timely manner.
2. Filling in notes and inspections
- After every visit to the apiary, add notes and inspections in the app (preferably with photo attachments). Thanks to this, it will be possible to analyze the history of activities and the system will be able to assess the situation more accurately.
3. Regularly checking alerts
- Check the Notifications tab in the app so as not to miss critical events such as disease detection.
4. Battery level check before the season
- Before the season, check in the app the battery level of all devices monitoring the status of your apiaries. Replace the batteries (2×AA in the Scale and VitalSensor) when the level is low; charge the Hub via the photovoltaic panel or mains. Avoid transmission interruptions at the peak of the season.
5. Updates
- Update the mobile app to the latest version (Google Play / App Store) to have access to improvements and new features.
- Operating system updates of the device also affect the stability of the app's operation.
Troubleshooting
1. Frequently asked questions and suggested solutions
1.1 No data in the app
Solution: make sure the devices (Hub, Scale, VitalSensor) are turned on, within BLE range (up to about 35 m from the Hub), and that up to about 2 hours have passed since the first start. Check the batteries and the Hub's power supply (PV panel or mains). A detailed list of problems and solutions related to device communication can be found in the Device configuration manual (Troubleshooting chapter).
1.2 I cannot log in
Solution: check that the user name and password were entered correctly. If you have forgotten your password, contact Apisense support: bee@apisense.ai.
1.3 Other problems
Solution: contact Apisense technical support: bee@apisense.ai.
Manual at a glance
Below you will find a summary of the most important activities in the Apisense Pro AI app. Each point contains a brief description and links to the detailed chapters of the manual; for selected activities a link to a short video material is also included.
1. Registration and login
- Registration: Download the Apisense mobile app or go to the system's website. Choose Create account, fill in the data (user name, email, phone), create a password meeting the requirements, and click Sign up.
- Login: Launch the app or website, in the Sign in view enter your user name and password, then click Sign in.
2. Apiary management
- Adding an apiary: In the Apiaries tab choose Add apiary from the bottom menu. In the Add apiary view enter the name and choose With devices (scan the Hub QR code) or Without devices, then save.
Video, Adding an apiary with devices, Adding an apiary without devices
- Editing an apiary: Click the chosen apiary tile. Click the cog icon while in the Hives tab. In the Apiary settings view click the header of the section whose data you want to edit. Change the field values and click save (yellow button).
- Deleting an apiary: Click the chosen apiary tile. Click the cog icon while in the Hives tab. In the Apiary settings view click the Delete apiary button.
- Adding a hive: Click the chosen apiary tile. Choose Add… → Add hive from the bottom menu. Fill in the data in the Hive details and Queen bee information sections and scan the QR codes from the Scale and VitalSensor devices. Click the yellow Save button.
- Editing a hive: Click the chosen apiary tile. Click the chosen hive tile. Click the cog icon while in the Details tab. In the Hive settings view click the header of the section whose data you want to edit. Change the field values and click save (yellow button).
- Deleting a hive: Click the chosen apiary tile. Click the chosen hive tile. Click the cog icon while in the Details tab. In the Hive settings view click the Delete hive button.
- Adding inspections: Click the chosen apiary tile. Click the chosen hive tile. Choose Add... -> Inspection from the bottom menu. Attach a total of 4 required frame photos. Answer the questions. The yellow right-pointing arrow lets you proceed to the next question. Click Finish inspection (yellow button on the last inspection screen) to save.
- Adding notes: Click the chosen apiary tile. Click the chosen hive tile. Choose Add... -> Note from the bottom menu. Enter the note content (text or record a voice note; you can also add photos or recordings (+)). Save the note (yellow button).
- Filling in the disease questionnaire from the apiary level: Click the chosen apiary tile. Choose Notifications from the bottom menu. In the Problems tab click the chosen disease row to expand the details. Click the Answer a few questions button. Answer the questions (Yes / No / Skip). To proceed to the next, click the yellow right-pointing arrow. At the end click Save.
- Filling in the disease questionnaire from the hive level: Click the chosen apiary tile. Click the chosen hive tile. Choose Notifications from the bottom menu. In the Problems tab click the chosen disease row to expand the details. Click the Answer a few questions button. Answer the questions (Yes / No / Skip). To proceed to the next, click the yellow right-pointing arrow. At the end click Save.
- Registering a sample: Click the chosen apiary tile. Click the chosen hive tile. Choose Add... -> Register sample from the bottom menu. Choose the sample collection date and the test type. Click the Generate code button. Write the Test code on the sample and send it to Apisense. (Note: the Register sample option is only available for a hive with an assigned VitalSensor device).
- Adding a test: Click the chosen apiary tile. Click the chosen hive tile. From the bottom menu choose Add... -> Test. Choose the date and test type from the drop-down list, fill in the required photos and fields (e.g. number of varroa mites), then save with the yellow button.
3. Main panel and navigation
- Apiary list (Apiaries tab): The start view after logging in to the Apisense app - apiary tiles with basic information. Click an apiary to go to the hive list.
- Apiary map: After logging in to the app, choose Map from the bottom menu to see the apiary locations. You can filter the view by problems (e.g. Varroa).
- Hive list (Hives tab): Click the chosen apiary tile. As a result, all hives assigned to this apiary will appear. The Hives view presents a list of hives; click the chosen hive to go to the details.
- Hive contents (Details tab): Here you check the Hive status, saved inspections, notes, and the list of tests and samples. You can also display charts of individual parameters, e.g. Honey gain.
- Apiary and hive settings: The cog icon in the apiary view (Hives tab) or hive view (Details tab) leads to the settings. Here you can edit information about the apiary or hive.
4. Monitoring and data analysis
- Parameters (temperature, humidity, pressure, weight, honey gain): Click the chosen apiary tile. Click the chosen hive tile. The current values are visible in the hive Details tab, Hive status sub-tab, in the Weight and Conditions sections.
- Charts: Click the chosen apiary tile. Click the chosen hive tile. In the Details -> Hive status tab expand the Weight or Conditions section and click the chosen parameter to see the chart in the chosen time interval (24 h, 7 days, 1–6 months).
- Trends: Click the chosen apiary tile. Click the chosen hive tile. In the Details -> Hive status tab expand the Weight or Conditions section and click the chosen parameter to display the chart. On the chart screen turn on the Show trend toggle.
5. Alerts, notifications and AI Assistant
- Notifications: Click the chosen apiary tile. Choose the Notifications tab from the bottom menu. The available categories are: Problems (including diseases) and Technical (devices, connectivity).
- Your AI Assistant: From the bottom menu choose Your assistant (accessible from the Apiaries, Hives, Details views), then enter a question and send it to the assistant. The assistant will analyze the data and provide an answer.
6. Account
- Editing user data: In the Apiaries start view click the cog icon. You can change your name, email, phone, password and language. From this place you can also delete your account.
- Checking the app version: In the Account settings view scroll to the bottom of the screen — you will see the Version X.Y.Z entry.
7. Reporting problems and suggestions
- Reporting in the app: Click the light bulb icon in the upper right corner of any view. Fill in the category and description, optionally attach photos. Click Send suggestion.
If you encounter any problems, search for the issue in the Frequently asked questions and suggested solutions list or contact Apisense support: bee@apisense.ai.